
The stock markets of the world have all rallied in the past few days. We have 4 outstanding short-term ‘buy’ recommendations in two Latin-American markets and in China and Canada. These were issued on the 25th and 28th of last month but the signals have only been of partial use. We caught the lows of the Chinese index that we used to generate the signal but the other markets just ‘flattened off’ their declines and went sideways for almost two weeks followed by two days of weakness into the actual low points:
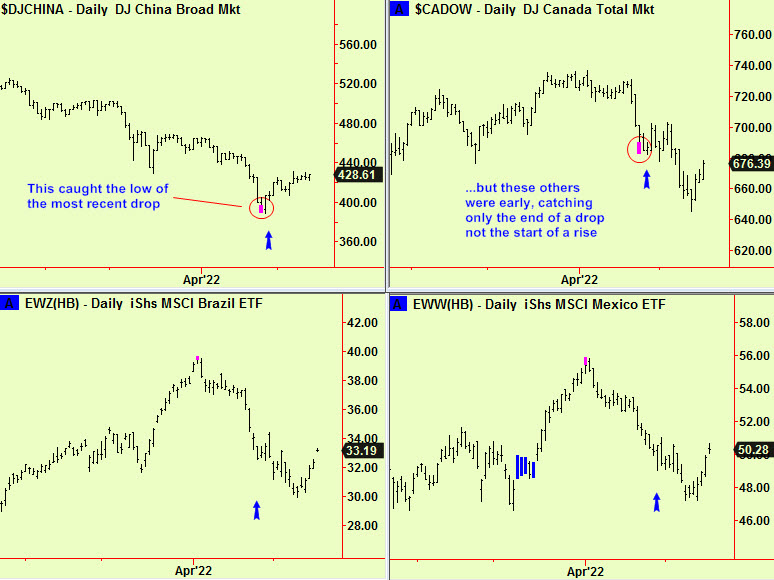
These recommendations are now nearing the end of their shelf-lives. The sensible thing to do if you have a profit as the end of the (roughly) three-week life of a daily signal approaches is to place a fairly tight stop-loss and see if some further reason emerges to keep the trade for longer. This applies to our long position advice in China, where there are already weekly-scale bottom extensions. Otherwise, the expiry of a signal means that we have no ‘edge’ so these other trades can now be ‘scratched’.
One thing is worth pointing out – the Brazilian, Mexican and Canadian equity markets all have a ‘resource flavour’ in that they are all commodity exporting countries. Despite the astonishingly high levels of grain and energy prices, their price movement has been mostly downward and these recent rallies have been modest. This is probably a clue that we should be looking to sell these equity markets and get short as prices rise. We are watching for signals to tell us when.
Our views on most other equity markets are that they are still in (or have just embarked upon) periods of weakness. We reiterated this view of Europe in the last edition and pointed out that the US had only just pushed down through support that had been holding it for over a year. We wait for signals on both sides of the Atlantic to tell us that this rally is stalling. If short Europe, stay short.
We reported monthly and weekly-scale top extensions in various parts of the US Treasury yield curve in recent months, so we called for an end to the bear market in bonds. Here are those signals, updated:
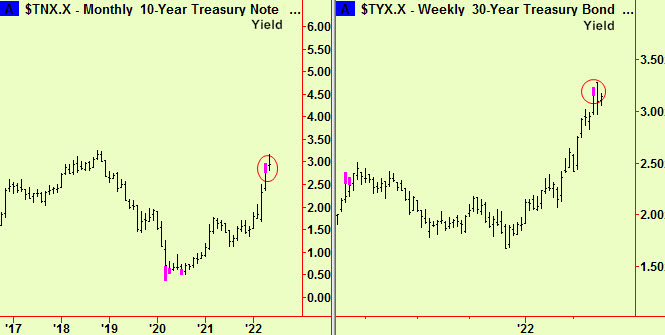
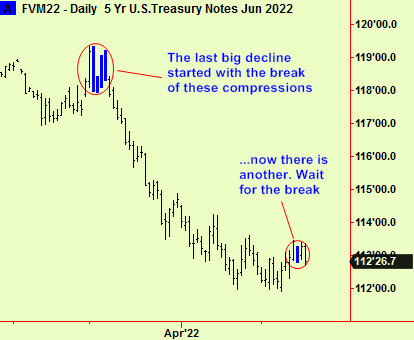
These longer-term signals are not too useful as a timing device as the accuracy of all our signals is usually +or- a period or two. Being two months early could be expensive, so we regard them as warnings that we should look for shorter-term signals, for trading purposes. There is now a daily-scale compression signal in the five-year price. This has yet to break, but so far today the market is trading below it. If it closes there, we may see a bit more weakness but this would not turn us into bears – it would just mean that there is no urgency to get as long as possible. Here’s that chart and we will follow this for the next few days with any relevant update:
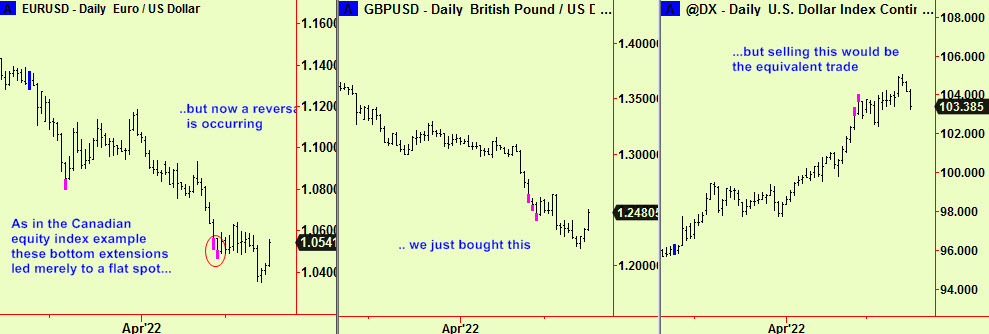
We called for an end to the current up-move in the US$ in the April 28th edition and to sell short (i.e. buy other currencies) on any signs of reversal. That is happening now, so here is an update to the three charts used in that edition:
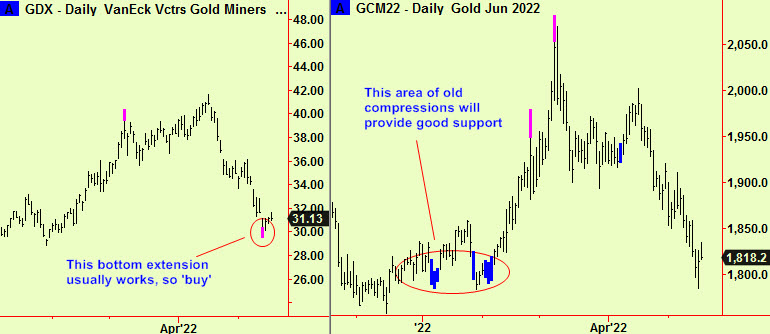
We have advised trading gold from both sides of the market in the past two years, with good success. It is time to try buying it again. The price itself has dropped to some support from an extensive area of old compressions (second chart) while an index of gold mining shares has dropped into an extension (first chart). There is no need to risk much, as the support ends at about $1775 per oz.
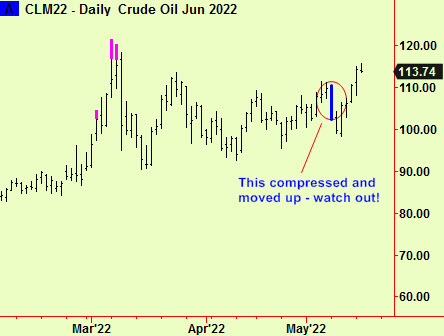
Lastly, crude oil. Although crude has risen to its current price many times in the past, it has usually fallen back quickly to the range where Saudi Arabia/OPEC prefers to keep it – between $50 and $70 a barrel. Now it has stayed at or near $100 per barrel since March 1st, a week after Putin’s army invaded Ukraine. Now there has been a compression at a daily scale that is breaking upward. It originally started to break downward but we chose not to follow it. Neither do we advise buying on this upward break (at least not just yet) as our preferred tactic is to see the break occur and then take a trade when the price re-visits the compressed area. This happens around 80-85% of the time but of course when it doesn’t, we miss the trade…
All signals generated by software produced by our friends at Parallax Financial Research www.pfr.com


