
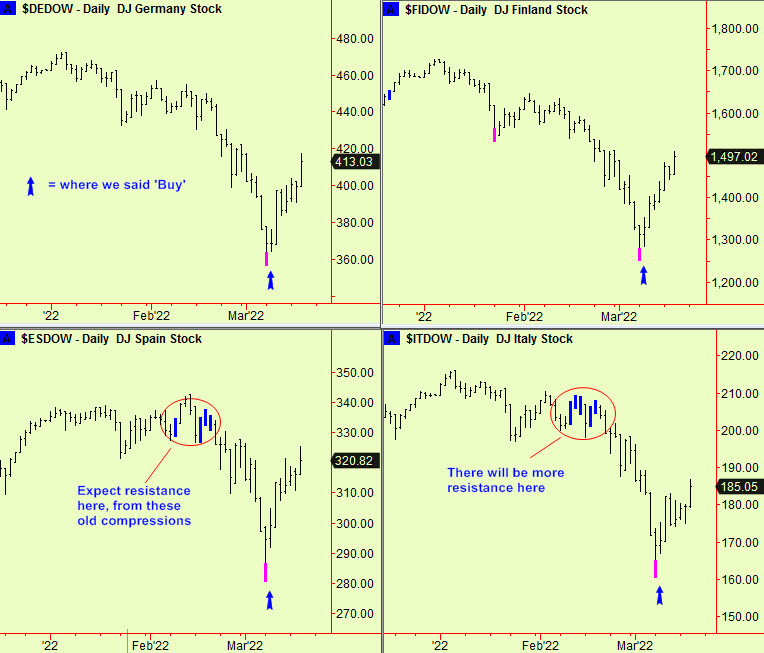
In the March 8th edition, we wrote ‘All change’ in the header of the emailed version. We expected the various markets movements in process at that moment all to end and reverse. Here’s an update, first to equities, using the same charts to illustrate the advice as in that edition. There has been a good rally and there is now some resistance hereabouts:
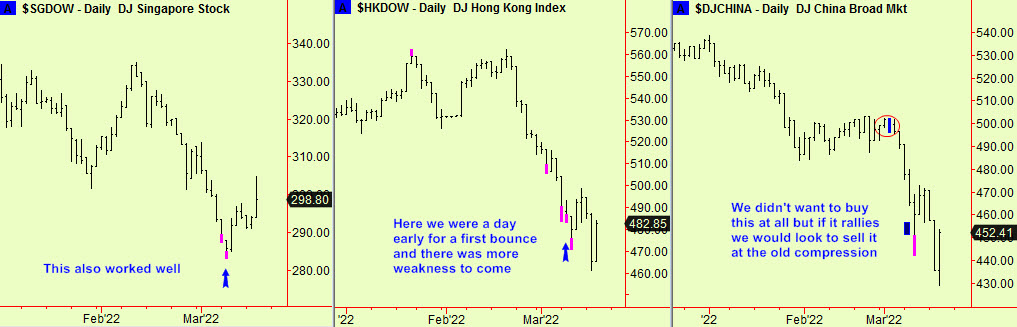
Among the general expectation of ‘All Change’ we included two Asian indices, in Singapore and Hong Kong. The first worked well, the second not so well, but we redeemed matters by pointing out that Hong Kong’s bigger brother in Beijing was not yet an obvious buy. In fact, if it does rally with the others, we would be trying to sell it on an approach to the levels of an old compression:
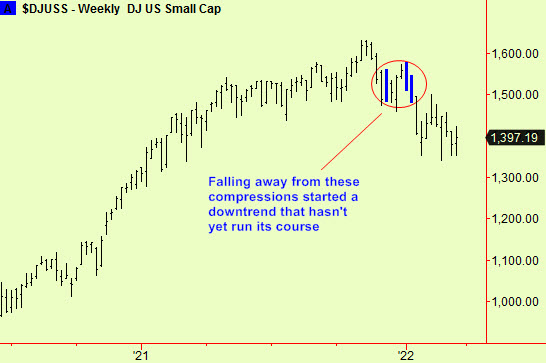
We did not include US equity indices in this analysis, because there were no new signals. The main influence there is still the break downward from weekly-scale compressions in various indices, as reported here many times. We use a small-cap index to illustrate this as the levels are very clear, so here it is again:
Next we looked at Gold and the $. We used a top extension in a Gold mining share index to make the recommendation to sell Gold (to take profits on the longs we have been advising) but the effect on the metal itself has been even more dramatic. We also advised selling the $ against the €, which worked well so far. These signals are at a daily scale, so they (and those in the European and Asian stocks) still have a week or so to run:

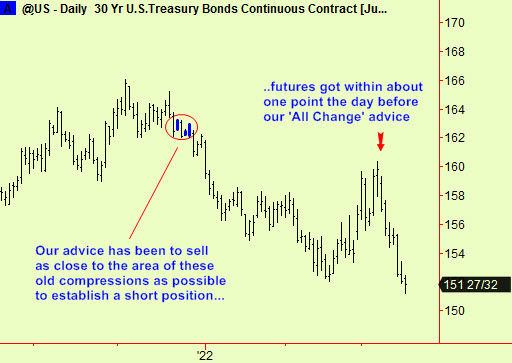
We have been advising for over a year that Bonds are in a bear market. We also been advising in recent editions to sell US treasuries on any rally that got close to the level of some old compressions where we expected resistance. The market got within a point of that level a day before our ‘All Change’ advice, and has since fallen away, so we assume that was it – the bear market has resumed. An update:
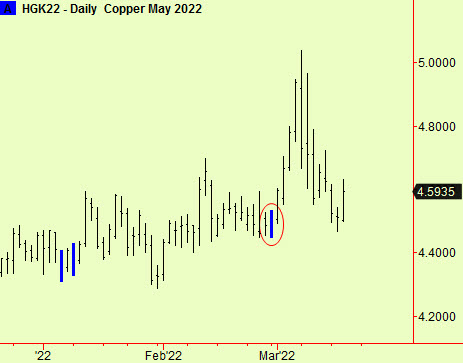
Lastly, Copper. We have tried to catch some of the churning moves in Copper in the last few months and now here is another one. Futures moved up from a compression at the beginning of the month (ringed in the chart) and have now returned back to that price level. We remind readers from time-to-time abut compressions. They act as ‘Attractors’, the phenomenon known from mathematical complexity theory. When formed, they signify that a change in market dynamic is imminent, usually a new trend but sometimes just an increase in volatility. The trend soon begins but then the price usually revisits the compressed level before the trend continues. Accordingly, if the trend starts upward, we wait, then buy the dip back to the compressed level. That is happening here, so buy Copper.
All signals generated by software produced by our friends at Parallax Financial Research www.pfr.com


