
As we warned was likely, compression signals did occur in the main US equity indices yesterday and in two European national indices and Japan. Several other US indices and one in Canada also compressed but all the charts look very similar, so we show only the three main US signals. The first two charts are of US futures and so there is some price activity from today, showing that these compressions are breaking upward. The third chart is of the Dow which has yet to open as I write:
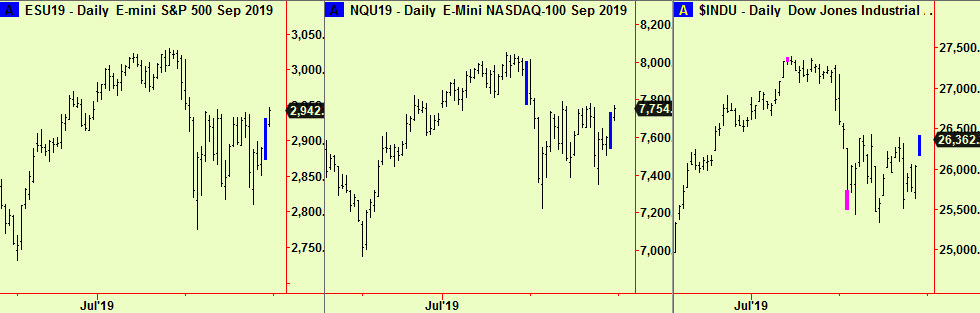
As ever, we cannot know which way compressions will break and an early move in the day in either direction can be misleading – we should wait for the closing price to be sure that the break persists. We have an outstanding bull recommendation from the August 16th edition which was at the first of the two low points this month and we would now stay long but place a stop to protect profits just below the levels of these new compressions. The relevant level in the September S&P futures is 2875.75
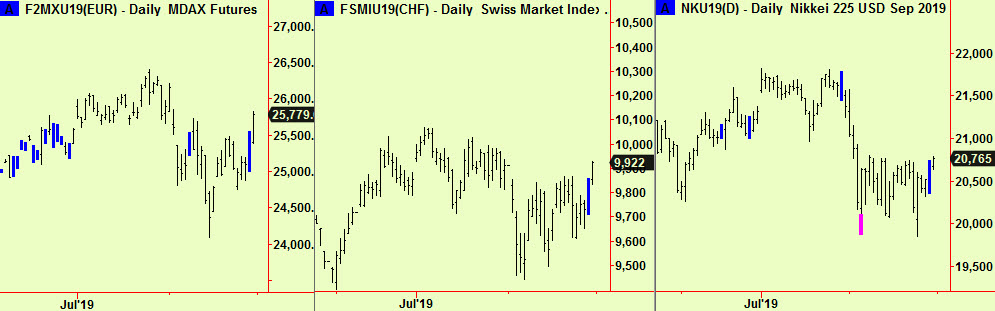
The first of the next three charts shows the MDax or second tier German index. There is no signal in the main index, the DAX. These three compressions are also seemingly breaking upward, presumably as part of the general relief that the world is not quite so unfriendly to investors as the mounting wave of dread over the past few weeks indicated – a possible Brexit deal, a bit of long overdue adult behaviour in the China/US spat and some sober reflection that things still remain unbroken in the world’s main economies. If these compressions do break upward, the subsequent rally could be broad and brisk.
All signals courtesy of software supplied by our friends at Parallax Financial Research www.pfr.com


