Track Records
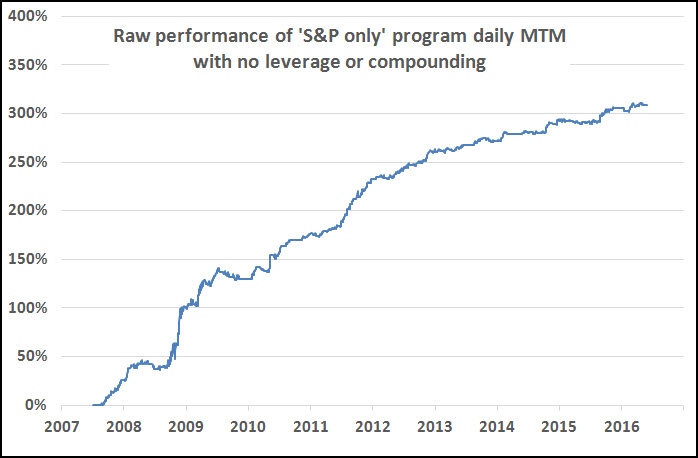
1 – S&P simulated
HED has been publishing analysis since 1999, adding time-stamped trade recommendations in August 2007. Over time there have been many more comments and recommended trades in the S&P and other related US stock index futures than any other asset, sector or instrument, so here we have strung together the results of those trades, as if adopted at the time of advice, allowing for a few moments to execute. These are ‘raw’ results meaning that there has been no compounding (which would greatly magnify the effect) but also no deduction of fees, which would reduce the effect a bit:
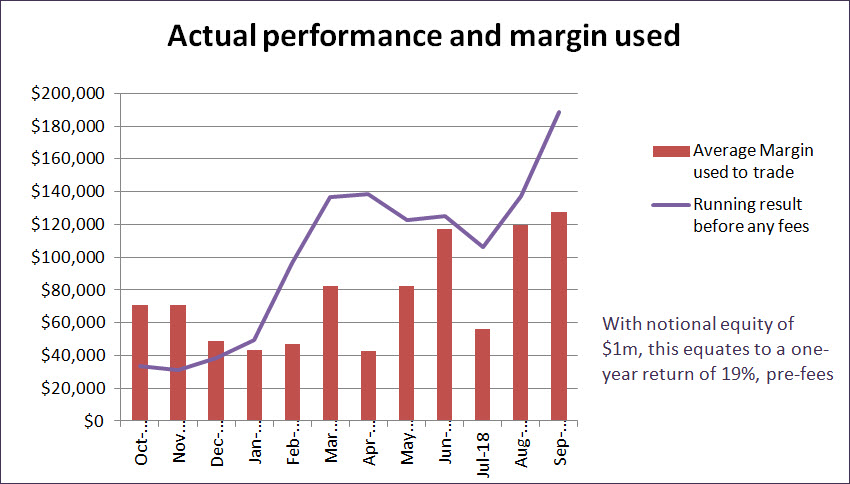
2 – All markets actual
This is the picture of actual results of a program that began trading with real money in October 2017. The trades are all in futures taken from the four main asset classes – Equity indices (in the US, Japan and Europe) Government bonds in the US and Europe, Commodities and Currencies. Each position is ‘boxed’ by a stop-loss, a ‘time out’ and a profit-taking rule and the position sizes are calculated to keep risk constant. There is a slight emphasis on equity index trading because there are more trades in that area that we can identify – there is simply more information. The dark line is the running total of profits and losses and the red bars are the monthly average of futures margin requirement to support those trades.