
Today is the first day of a tight cluster of turns in US equities and bonds. We wrote of this in the last edition but it is worth a bit more space here as these turns come from a different (longer-term) series that is not included in our regular turn calendar updates posted in AlphaMail. These longer-term turns are much rarer and tend to pick out the more important high and lows. As ever when using turns it is important to recognise what they do and don’t signify. Any one of the turns that we identify means that we expect a market high or low around that day. Here the prior trend is all-important as we do not know in advance which to expect – prior uptrends lead to highs at turns whereas prior downtrends lead to low points.
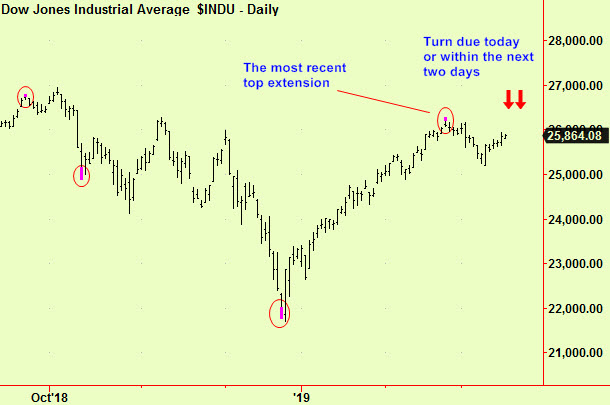
Today we have a clear prior uptrend in US equities in which the S&P and Nasdaq have already made new local highs, (i.e. since the lows of December last year) even though the Dow has not, so we are looking for this turn to mark a quite significant market high. There is no obvious prior trend in bonds. The turn cluster in both assets lasts for three days (i.e. from today until Wednesday) and the high in stocks could occur on any one of these days, with a slight preference for today.
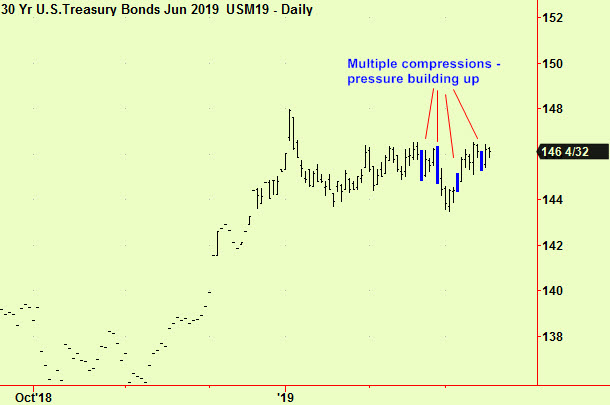
There is no such clarity in bonds except that the turn cluster spans the same three days with no preference as to which day will be the most significant. When there is no prior trend, the turn signal is still ‘valid’ but it will probably lead to a new trend whose direction we can not determine in advance – wait and see what happens in the bond market then jump on board – these ‘turns from a flat prior trend’ act very like compressions. Bonds are also compressed and the combination of these two signals (turn and compression) might mean we are due for a dramatic move. We are currently short and will protect that position with a very close stop.
Tactically, the best approach in stocks is to wait a bit until there are signs that the market is running out of steam and then take a short. These signs might be any of the usual tell-tale clues:
- Repeated attempts to push through the new high (currently set at 2840.75 in June S&P futures as I write) followed by some sharp weakness at any time in the next three days
- A failure near the end of the day to sustain these new highs – perhaps the market closes lower on the day after making these new highs
- Some other ‘technical’ measure that you may prefer – there are many possible reversal pattern, each of which is only vaguely reliable. In these circumstances, they should be taken seriously.
It is not sensible to sell short just because the market is trading at new highs on a turn day. There have been no fresh top extensions that would reinforce our view of the turn (a combination of the two signals would make us instantly bearish) and it is easily possible that these markets will shoot even higher during the three days of the turn cluster, so becoming bearish too early might be uncomfortable. By all means ‘fish’ for a top if you can’t resist selling these high prices but be prepared to ‘stop out’ quickly if the market refuses to fall soon.
All signals courtesy of software supplied by our friends at Parallax Financial Research www.pfr.com


