
The latest move up in US stock index futures has now pushed prices up through the resistance levels that we first identified in the January 8th edition when prices were much lower. It is still possible that the present up-move will stall hereabouts but the probability of that happening has diminished a lot. It is normal for prices to test resistance from an old compression by rallying up to the levels where it occurred and then pushing a little way into those levels. It is even possible that prices can push all the way into the compressed area before falling back again but it is very rare for markets to push right through the area of the compression and then resume their drop:
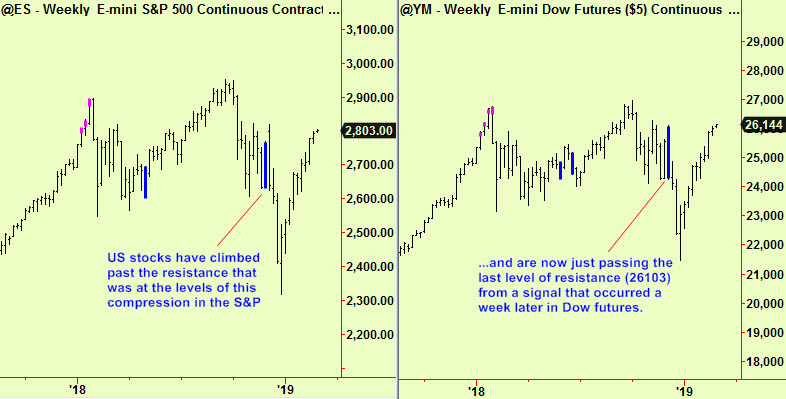
These two updated charts of the weekly compression signals that we first identified in that January 8th edition show that the area of compression in the S&P has already been exceeded and that the adjacent signal in the Dow (one week later) is being exceeded this morning. We are preparing an exit from the short position that we advised on February 6th and will probably jump out if there is no weakness in the next 24 hours or so.
The only remaining reason to stay in the trade is that S&P futures have yet to exceed the high price (2818) made in the week of the Dow compression. This reflects the nature of compression signals, which reveal a condition of uncertainty and disagreement among market participants, so if one index makes a compression signal it can be assumed that related indices are also in that same state. Complexity theory identifies these areas as ‘attractors’ (scholarly article here) that alternately repel and then attract the price and so this large compressed area still has that one remaining resistance to offer. Above it there is a vacuum, so don’t outstay your welcome.
All signals courtesy of software supplied by our friends at Parallax Financial Research www.pfr.com


