
Stocks did a typical range-bound ‘squeeze and dump’ earlier this week, rising to a peak on optimism after the G20 meeting but rapidly falling the next day as details of a truce in the trade war proved sparse. In the Monday December 3rd edition, we pointed out that the rally had only pushed prices to the top end of the range so that you should exit longs and trade from the short side. This has proved usefully profitable as prices are now already down to the bottom end of the range again, after a ~6% drop in only 4 sessions. Obviously you should now consider taking profits. The range will probably hold, leading to another bounce but here we review the evidence:
The main reason for thinking that the range will hold is that it is well-established. Its boundaries have become well-defined in the US, as shown in the chart sent in Monday’s edition with roughly horizontal limits above and below. This was not the case when we first called for a range to develop at the beginning of the year, when we had other reasons. Now there are seen to be roughly equal bull and bear influences operating and this has held the market confined for almost 12 months. Such conditions often last for much longer but with considerable volatility as mood extremes develop with great intensity – bulls abound at the top and bears at the bottom and their serial disappointments can drive large swings in price. The range will probably not remain so well-defined.
The lower boundary of the recent part of the range in the US has also been marked by support from old compression signals in the Dow – see first chart below. These are getting a little old to rely on, but the second chart shows more recent reasons to be optimistic. The weekly-scale bottom extension in the Value Line is only six weeks old and so will still be important for some time to come. The last chart reveals some reasons for uncertainty – there has been a new weekly-scale compression in the S&P 500. This means that pressure is building up and that a new move may be imminent.
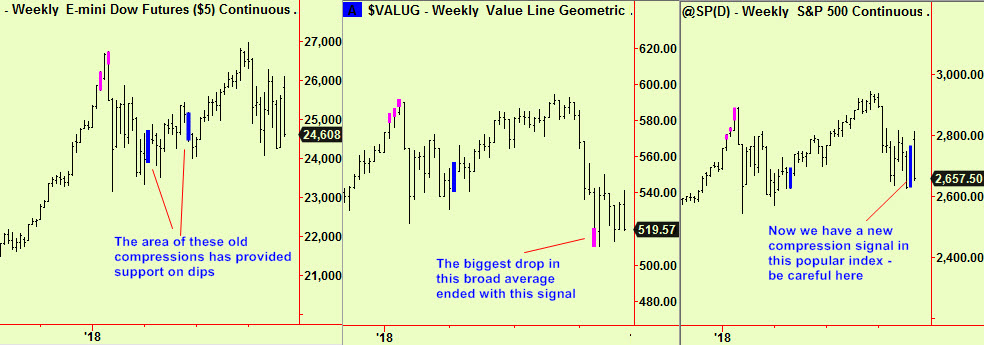
This last chart does not show that we should abandon our long-held view of a continuing range – it just warns that a new move is possible without telling which direction it will take. Some increased volatility is just as likely.
Elsewhere, the European markets are also at (actually just below) the recent lows, but there have been shallow downtrends all year in the Eurostoxx – here is an update to Monday’s simple chart, showing the boundaries that we expect.
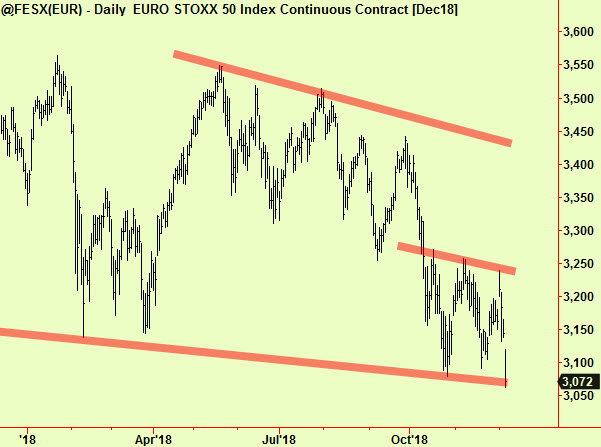
The danger with a shallow down trend is that it will steepen, so we are less inclined to call for ‘the bottom of the range’ in Europe until we see whether this slender support will hold. Money supply contraction has been pointing toward a slowdown in the Eurozone as we pointed out in the March 7th and November 28th editions and sometimes economic fundamentals do determine the direction of stock markets (although not usually). Be careful here as volatility is likely to continue and may even increase yet further.


