
Government bond markets have been mostly range-bound for the last few weeks, even longer in the US. The longer-term picture has been dominated by the gradual shift in monetary policy in the US and UK from ultra loose to gradually tighter and the prospect of the same thing happening in the Eurozone. Short-term rates have indeed risen seven times in the US from 0.25% to 2% in the 30-odd months since this gradual tightening began and the UK has now also begun the same journey with two rate rises in the last ten months. The European Central Bank has lagged behind this change of stance by keeping its ‘refinancing’ rate at 0% for the last two years.
The Eurozone has also lagged the US and UK by continuing to buy various debt instrument in the marketplace, a practice that the other two ended some time ago, before they started to raise short-term rates. The ECB will also end its program of purchases later this year, unless some further economic trouble looms, in which case they may keep buying.
As a note, the reason for this time lag is that the Eurozone is a single zone in name only. Germany and its peers have benefited greatly from the creation of the Euro 16 years ago but the less flexible countries that form a majority in the Eurozone have fared much less well by being tethered to a competitor. Making a single monetary policy for such a disparate group will always be a problem, but when times are hard the policy has to be as generous as needed by the weakest members. Italian and Spanish youth unemployment has been above 30% since the financial crisis of 2008 so this is a ‘rolling crisis’. We wrote a lot on this very problem several years ago, but this underlying ‘skew’ in favour of Germany and against the Mediterranean countries caused by the existence of the Euro is ever-present. Germans are told by their leaders that this is caused by the contrast between their sturdy national virtues and the faults of the feckless garlic-eaters in the South, apparently forgetting that Germany was the ‘sick man of Europe’ in the early 1990s and that Italy had its own economic miracle in the 1950s and 60s. Spain also has many bright spots that augur well for the future.
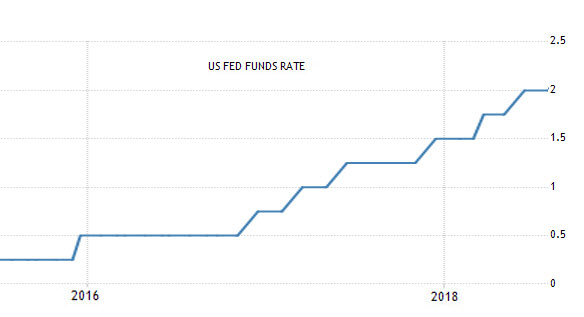
This is a chart of the short-term ‘Fed funds’ rate, which is the main lever that the US uses to manage interest rates:
In this same period of rising short-term rates, US Note and Bond yields have also moved up (after an initial dip in the first half of 2016) but by less, and with completely different timing. Here is a chart of 30-year Bond yields, with those 7 rate rises marked by arrows:
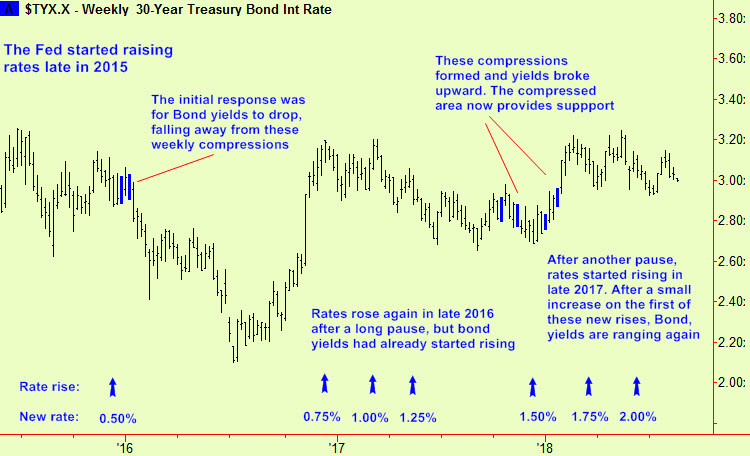
During 2018 so far, the rate of increase in Fed Funds has picked up a bit (the top chart steepens) but the Bond (and Note) yield has not increased at all – sticking in a range near the recent highs. This disparity is a so-called ‘flattening of the yield curve’ and has caused a few commentators to dust off their charts to see what has happened when this has occurred before. Some recessions have been signalled in this way but there is thin evidence to expect that this will happen again now – at least not yet. Instead, it looks as though the Trump tax cuts that have caused an uptick in economic activity have made the Federal reserve committee scramble to raise short-term rates a bit faster, lest inflation becomes a problem, although rates are still historically low.
The puzzle is why bond yields have not also risen, as the coming shortfall in US tax revenue will be met by more government borrowing which should add even more pressure for bond yields to rise and bond prices to fall (they are different ways of saying the same thing). Ultimately the hope is that more economic growth will lead to higher tax receipts, so the extra borrowing will be easy to repay. We suspect it will be more difficult than that, so bond yields will have to rise, at least in the near term.
Through our spectacles, the picture looks like this:
The increase in Bond yields mainly happened in one go in that sharp jump in the fourth quarter of 2016, just before the second rate increase. Yields have basically stayed in the same area since then, between about 2.7% and 3.2%. This is definitely odd and the answer to what happens next is probably found in the compression signals around the end of 2017/start of 2018. These eventually broke up and yields moved a little higher back up to the high part of the overall broad range between 2.9% and 3.20%. The area of those compressions is around 2.95%-2.75% which now provides good support.
There will probably be another upward move in US yields before long as there is no obvious resistance to hold yields down and the support at the 2.95% area has held on several occasions. The appropriate tactic is to sell bond futures whenever the bond yield approaches that support. Any little drop in stocks, or hint of economic weakness and the bond yield could dip a little more towards 2.95% and that would be the moment to sell bond futures. As I write the yield is 2.98% so now is a good moment.
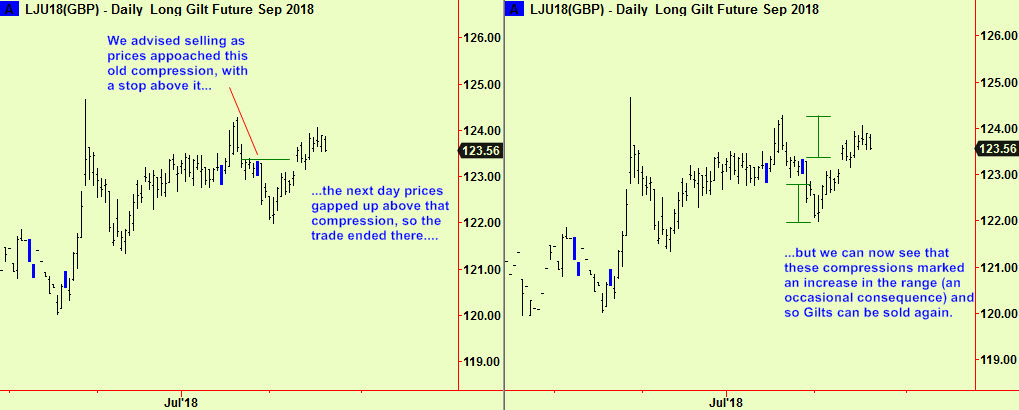
The situation is different in Europe as a later edition will analyse, but the conclusion is the same. For now, take a look at UK Gilts, where we suggested selling a rally in the August 9th edition. That trade ended quickly with a small loss but the compression signals that led to it have another possible consequence. Sometimes, compressions mark the point at which a range widens. When this happens the widening is usually symmetrical, so that the push downward out of the prior range is then matched by an equivalent push up through the same old range by a closely similar amount. In this case, Gilts have done exactly that – they dropped by a point through the old range and then rallied back up through it by about the same amount. That should mark the end of the rally (which has already failed) so we can try selling again…
All signals courtesy of software supplied by our friends at Parallax Financial Research www.pfr.com


