
Grains have traded in ranges since our April 19th edition. Here is an update to the chart published then, showing the same signals on the same weekly charts. The yellow banner makes an important point of signal interpretation:
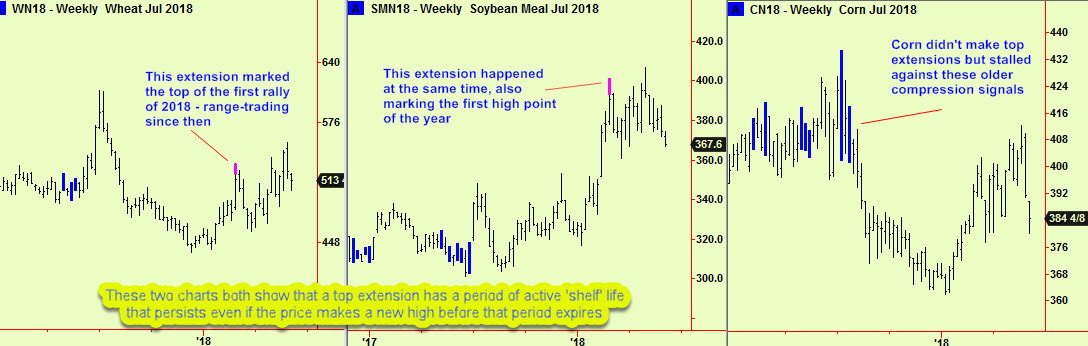
Range-bound markets will produce compression signals when sufficient time has passed and that has now happened in soya meal, as the second of these next two daily-scale charts shows:
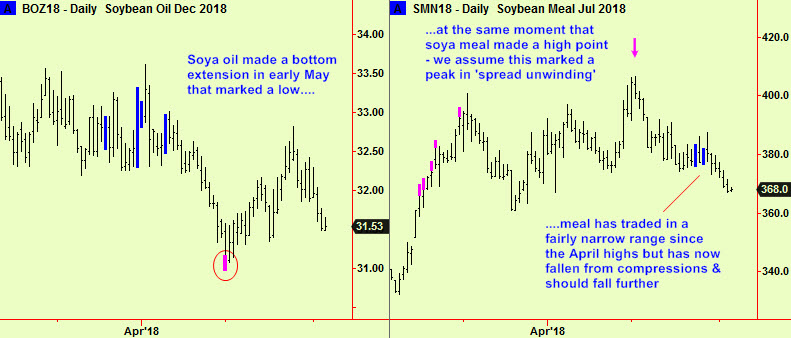
It looks as though there will be more weakness ahead in the Soya complex, with resistance at the level of these recent compressions. You can either sell hereabouts or wait for the usual ‘return movement’ that should occur soon, taking meal prices back to that resistance (about $8 above here) and sell then.
The others have no fresh signals but corn has stalled and will probably continue to trade lower and we will wait to see what develops in wheat. We remind you that there is plenty of grain in the world and that yields continue to grow by ~1% per year. So does population, meaning that there is a gradual rising tension that will lead to a price explosion when the next crop scare happens along. The 1% annual population growth is much more predictable than the increase in crop harvests…
Meanwhile, the price of Cocoa has been falling and has now made an extension:
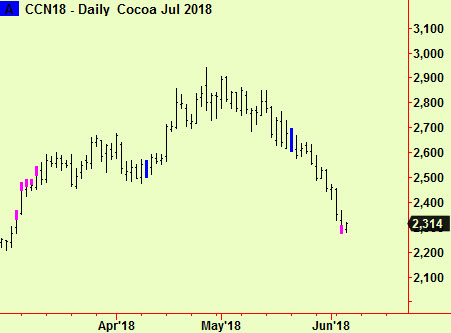
This has the usual meaning – this drop is overdone and will probably rebound from hereabouts. It is always tempting to buy markets that have made bottom extensions, as soon as we see the signal. This can work well, if there is to be a ‘V’ bottom but we prefer to wait a bit and ‘stalk’ the market with a view to buying when the drop has clearly ended.
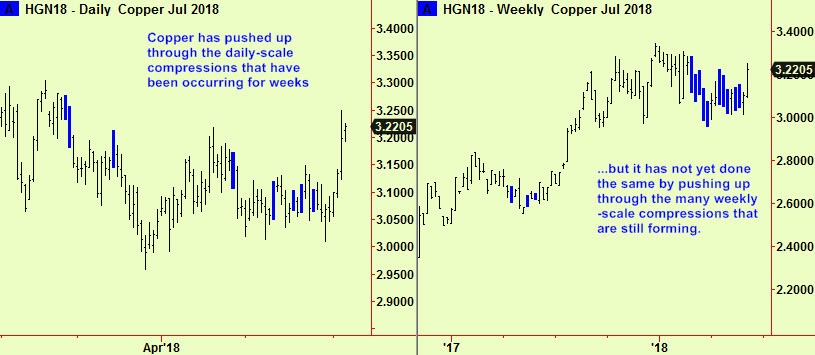
Copper has jumped by 20 cents in a few days and has now traded comfortably above the daily-scale compressions shown in the first chart below. We are sceptical of its ability to sustain these gains however as the weekly-scale picture shows that it is still within the area of compressions at that time frame. We would like to sell but the evidence is too thin. We wait.
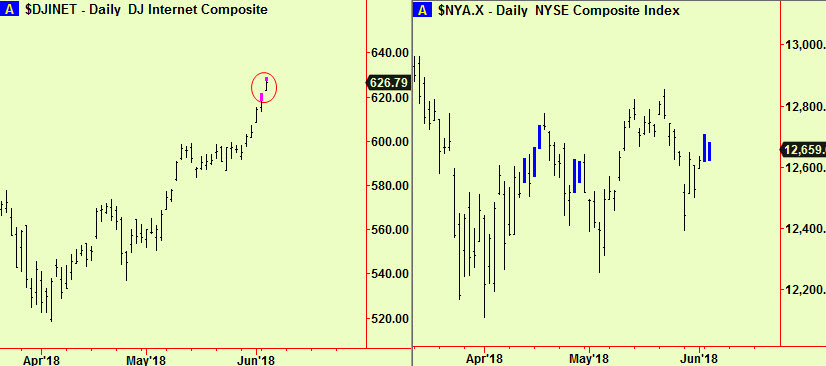
Lastly, there have been 2 top extensions in an index of internet stocks that we follow. This is closely correlated with the Nasdaq futures contract so we are looking for a place to sell US indices short again. The usual caveat applies with top extensions – unlike bottom extensions, which quite often mark a low point, top extension signals usually mark the beginning of a ‘topping process’ that can last a while. This is the first warning that the current ‘up-leg’ in US stocks is nearing an end and prices are generally still within the trading ranges that we forecast at the beginning of the year – as shown in the second chart below of the NYSE composite, which re-compressed yesterday. We are poised to act. Not long to wait, we think:
All signals courtesy of software supplied by our friends at Parallax Financial Research www.pfr.com


