
The range-bound, generally compressed conditions in most asset classes that we have reported in recent weeks may be starting to resolve. US stock markets continue to make new compressions but it looks as if bonds, gold and (maybe) the $ have all started new trends. Bonds first – as we wrote in the April 10th edition, the scene was set for declines that have now started:
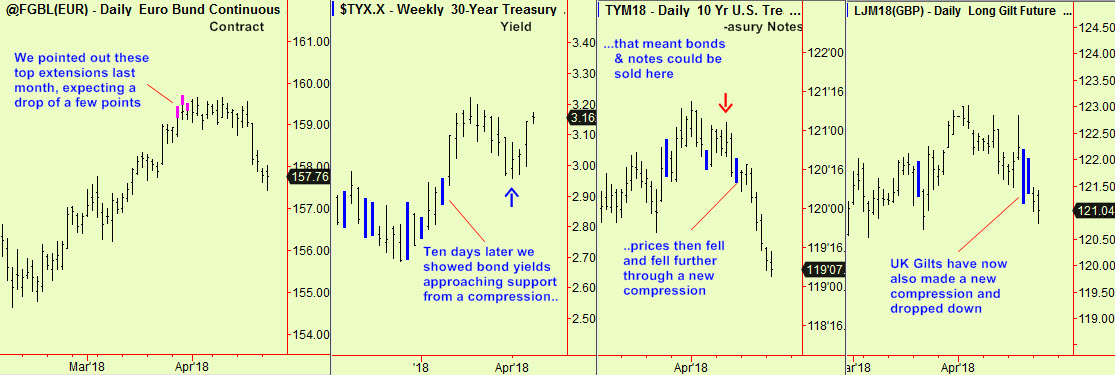
All of which evidence points to a decline that has started and has further to go. Will it be the meltdown that QE sceptics have always forecast? It is possible but rather more likely that we are merely embarking on the next ‘leg’ down in a normal bear market in Bonds.
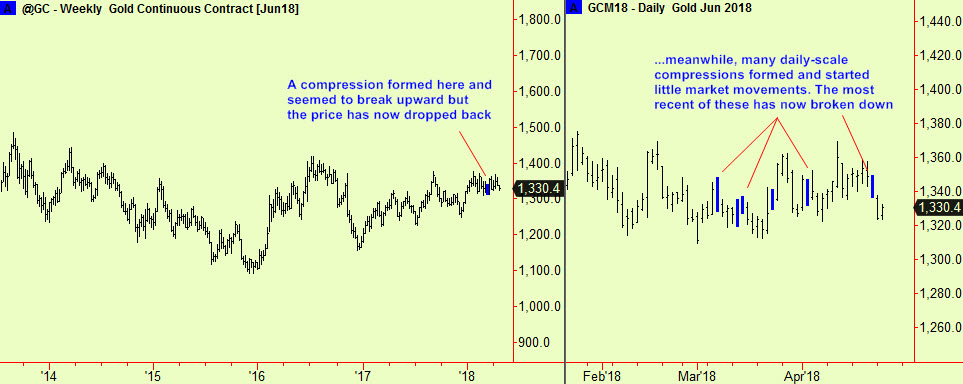
Gold has been trading in a big range for 5 years and making compressions from time to time – at a weekly scale in March and at a daily scale every week or so recently. Now the most recent daily-scale compression has broken down, which probably means that a bigger down move is imminent. Because this is not the first of these signals to form, we cannot be sure that the range is breaking but it fits with the bond picture. All assets are vulnerable to drops in value in a rising interest rate/tightening monetary environment so we should pay attention, even if this turns out to be another false break…
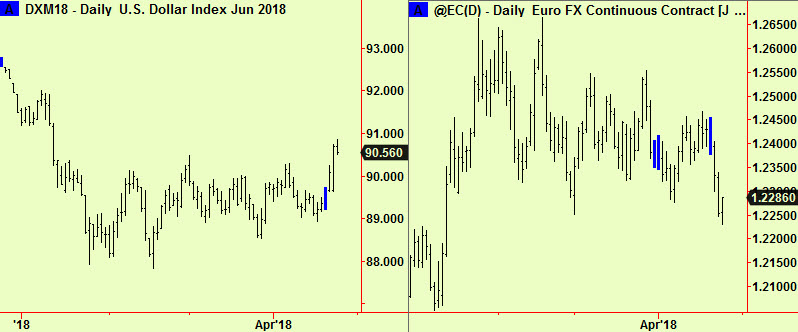
Currencies have also started to move more. The $ index has moved up from a recent daily-scale compression and Euro futures have moved down – these two are very closely aligned as the Euro is a large part of the basket against which the $ index is calculated. They have both been (and still are) in broad trading ranges, but it looks as though these ranges are breaking in the direction of a stronger $:
The world’s stock indices have not yet made breaks out of their trading ranges. We pointed out a top extension in Greece (updated below) and that was joined by one in a UK index 2 days ago.
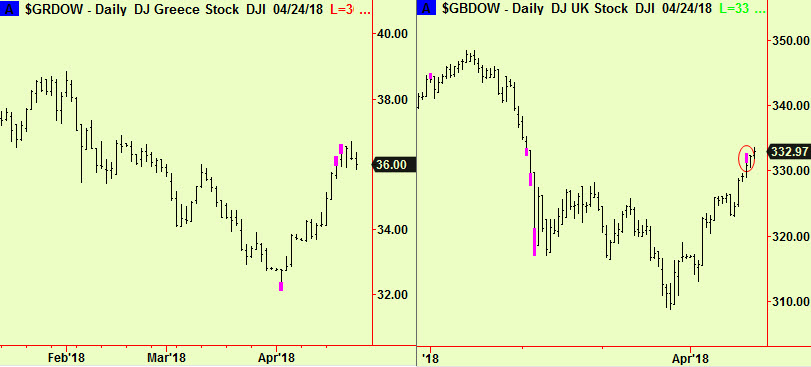
This means;
- that our advice to sell the US given in the April 16th edition still holds and that we now expect the lower end of the range there to be the next stop. It is not quite so simple however, as we can’t tell where the bottom end of that range is situated – the old low is at about 2550 in the S&P, which is about 3.5% below current levels (2645 as I write) but we expect the range to become quite erratic.
- Sell the UK too.
We expect to get signals when it is time to reverse yet again and will advise. There is some danger that the overall trading range will break downward (as mentioned a number of times) but there is a stronger likelihood that it will continue for some time to come.
All signals courtesy of software supplied by our friends at Parallax Financial Research www.pfr.com


