
Grains have been in a multi-year decline since prices peaked in 2012. The decline is attributed to increased harvests which in turn are due to higher yields, not an increase in planted acreage. Most land that can be reasonably used for agriculture is already cultivated and so the only way to grow more food is to get more crops from existing space. Wheat and corn (maize) yields have been rising by a little over 1% a year for a long time, partly because of better farming but also because of increased carbon dioxide in the air. This (and water of course) is the raw material that plants use to grow, so the increase of CO2 from 300 parts per million fifty years ago to 400 ppm today has produced this unheralded major benefit.
The world needs this windfall as annual population growth is also just over 1% and these two large and increasing numbers – people and the food they need – are in rough balance. Food is winning slightly, as measured by the increase in unused stocks at the end of each year but there need only to be some dip in production for this delicate situation to be tipped into deficit. Population growth is steady, but harvests can fail.
There have been some signs that the decline in grain prices may be ending, as we have remarked in the last few months, but the end of a bear market doesn’t lead straight into a new bull phase, so we are cautious here. Typically, prices of commodity markets ‘bump along the bottom’ after a bear market ends, before the supply vs. demand seesaw tips enough for a new bull market. Here is the evidence, in order of time frame, starting with the monthly picture:
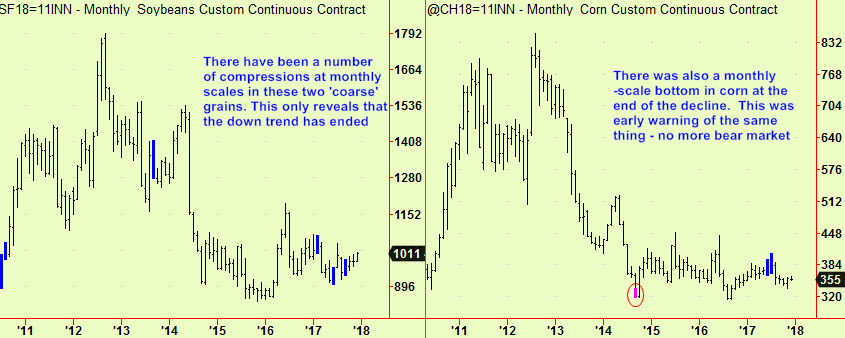
Please note that monthly-scale compressions do not help much with trading, so we don’t pay much attention to whether they break up or down – they simply ‘set the scene’ for shorter-term signals.
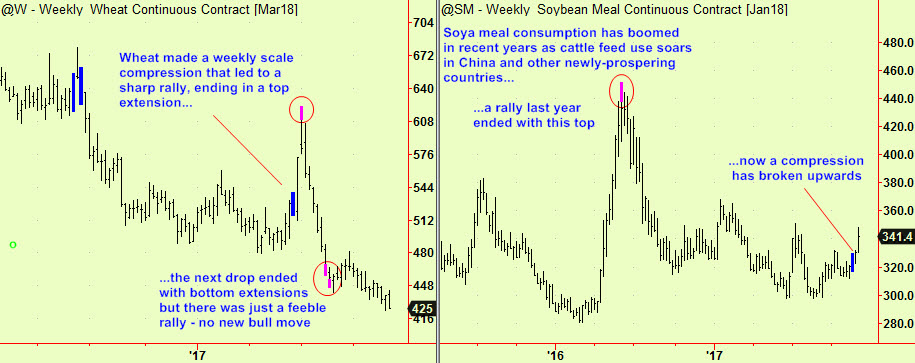
Weekly-scale analysis has been useful, firstly in wheat and soy, during this current period of ranging prices/downward channel that may be ending:
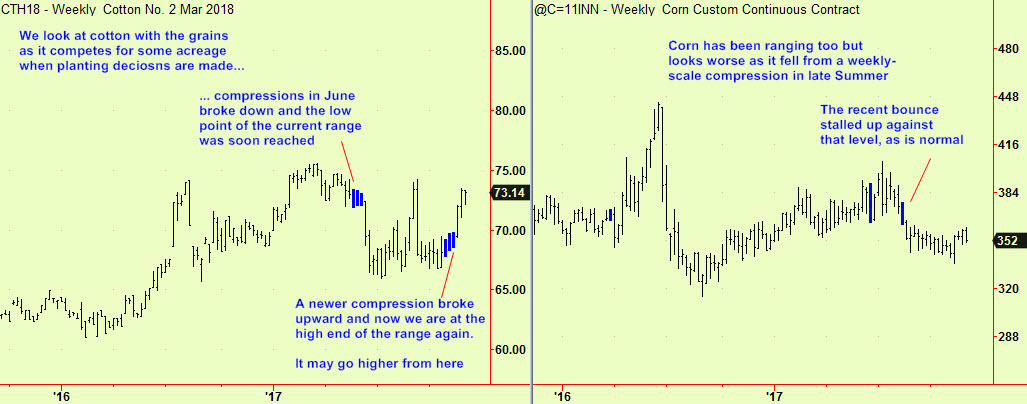
The weekly-scale picture in cotton looks constructive as the most recent compressions have broken upward, but corn still looks poor after breaking downward from its own weekly compressions:
At a daily scale, there is little to show that an up-move is imminent in any of these markets, except for soybeans. There we have seen a daily-scale compression that broke upwards 3 days ago. The price is re-visiting that area of compression now and this is where we expect to find support, as usual. Buy at market, risking just below the compressed area (the low of it is 985). The signal has occurred in January futures but it is better to buy a bit further ahead – perhaps in March, which is priced about 10 cents higher.

All signals courtesy of software supplied by our friends at Parallax Financial Research www.pfr.com


