
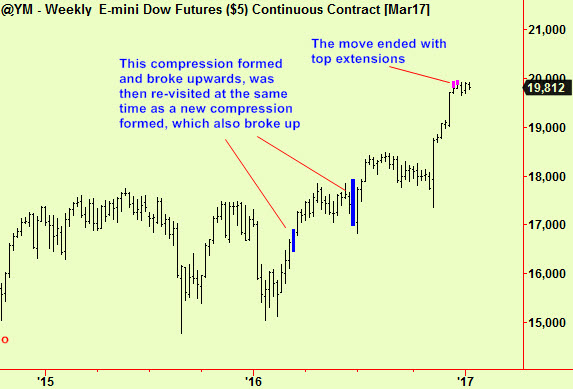
Equity prices have diverged quite a bit. In Europe the UK FTSE has been making new highs as the falling pound makes it more attractive to foreign buyers. China has fallen from a high point in early December and there is all kinds of behaviour in between. Let’s start with the US:
This weekly-scale analysis shows the evolving bull move since early last year. Compressions formed and broke upward twice until the move ended with top extensions in mid/late December. We always point out that top extensions rarely result in a quick turn-around from up to down and prices have indeed been moving sideways since those signals. New highs are possible but the main upmove is very probably over for now:
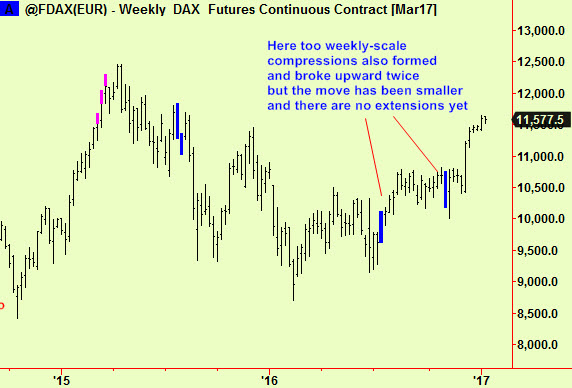
Europe has also moved higher and the German Dax can serve as an example of how. The picture is almost the same but there has been a more muted rise and no top extensions to end it (yet, but we don’t always get them):
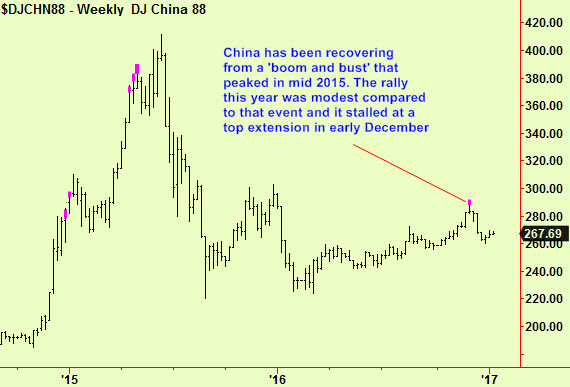
Asian markets have been different. China also rose throughout 2016, but it was recovering from a mini-bubble that burst in 2015. The recovery time needed from a burst bubble is longer than that for an ordinary bear market and so it is to be expected that this market will stall. It did so after top extensions in early December and has since dropped 7%.
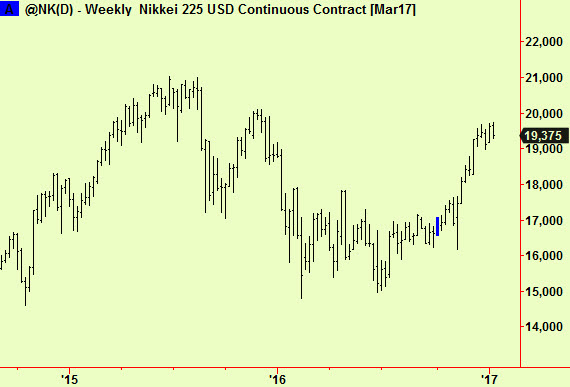
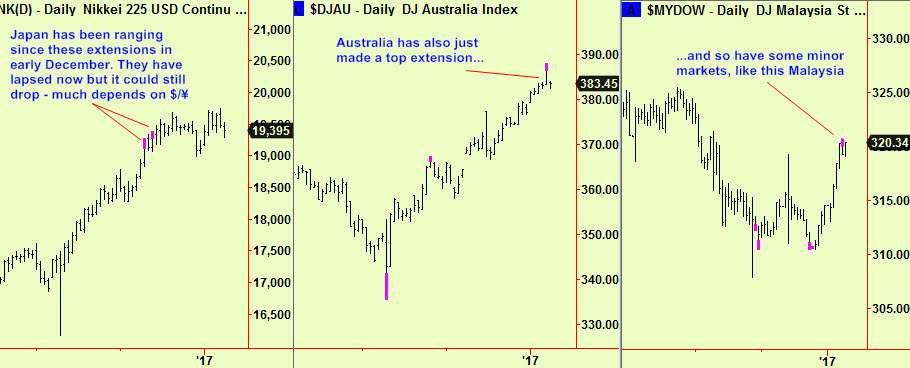
Japan has been relatively quiet as the market still struggles to deal with the enormity of the government’s debt and the slow pace of growth despite aggressive monetary stimulation. Prices have risen but only a bit. No weekly signals here but there were some dailies a few weeks ago, as we show later:
The differences mostly show up at a more detailed scale. The next charts and signals are all at a daily scale. The Italian market has been the most surprising beneficiary of the rally, especially as it came shortly after a referendum on their constitution and a result that was not obviously positive. On further consideration, that result moved the opposition parties a bit closer to victory in the elections that are now likely this year and they are all opposed to Italy’s continued membership of the Euro. Release from that ruinous currency union would free Italian business to prosper, so this was actually a rational response.

Elsewhere, Japan made daily-scale top extensions in early December and this marked the imminent stall of a good rally. Since then it has range-traded but it is still possible that it will drop from here. Those other markets in the East that have risen have mostly made top extensions now we expect at least a pause:
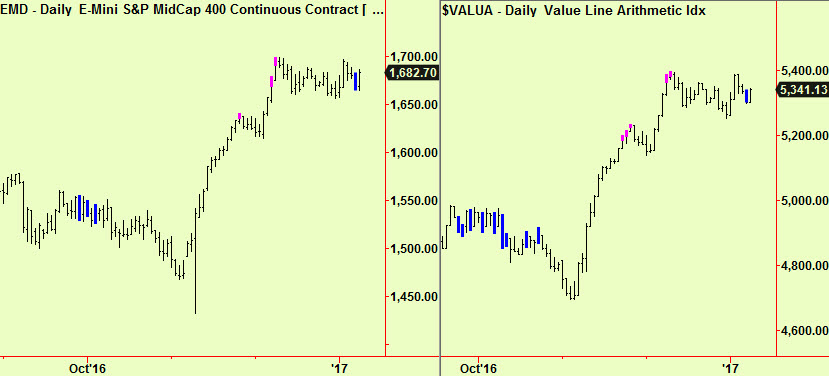
In the US, markets (with one exception) stalled in December. They have since traded sideways and we are now starting to see compressions. These will soon break one way or another, although we may need to see more of them before that happens. We have not seen any in a major index yet, just in some of those with a larger catchment area:
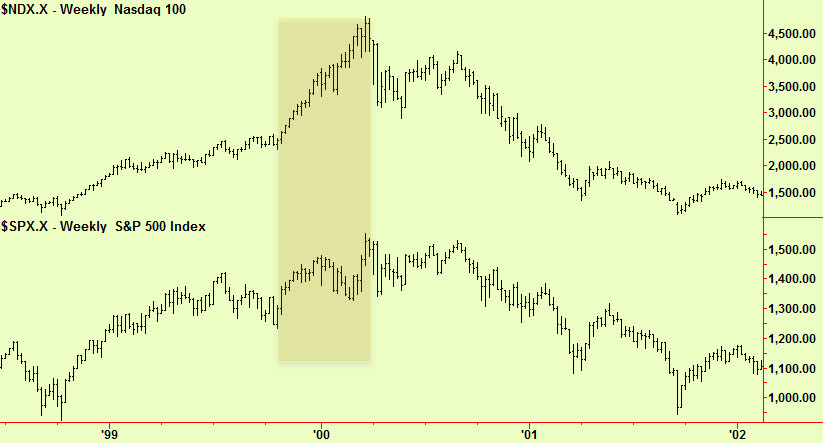
The exception has been the Nasdaq. That has pushed to new highs which means it may be forming a bubble. We wrote extensively on this possibility last year and now it may be happening. We have been a bit concerned that bubbles generally don’t form in the same asset in quick succession and the Nasdaq made a big bubble in 1999/2000 which makes it less likely. It’s still possible however, so let’s look at a chart of the Nasdaq and the S&P from that time to show what happened. The bubble period is highlighted and it shows that the S&P made hardly any headway while the Nasdaq climbed from 2500 to 4800 – a 90% rise.
Accordingly, we would now completely change the advice given in the December 9th edition that the Nasdaq was among the better short candidates. It is now a candidate to buy and the best way we can suggest to deal with these choppy conditions is to buy the Nasdaq on dips and sell the Dow or S&P on rallies.
Otherwise our advice remains the same – don’t trust this equity market rally but do not rush to sell short. It may well be that prices will trade sideways in many markets and even (fleetingly) make new highs for the rally but the risk is greater that prices will fall. As I write we are short of the Dax and Nikkei, long the Nasdaq, but we don’t expect to keep that long position for more than a few days. We expect to follow our own advice and trade both sides of the US markets – when we are long it will be the Nasdaq, when short it will be the S&P or Dow.
One last thought on the relationship between energy prices and equities. Crude oil prices have dropped $4 in a few days but this has not affected the general stock market at all. Last year, any weakness in energy prices led to worries about the high level of outstanding debt to the sector and the risk this posed to banks and the general economy. This year, presumably because frackers have reduced their operating costs so effectively, that is no longer a risk. Now, lower energy prices will probably give a boost to stocks as they always did in the past, like a tax cut. Saudi Arabia gets less money so the consumers of the world get to keep more of theirs.
Happy New Year
All signals generated by software supplied by our friends at Parallax Financial Research www.pfr.com


