
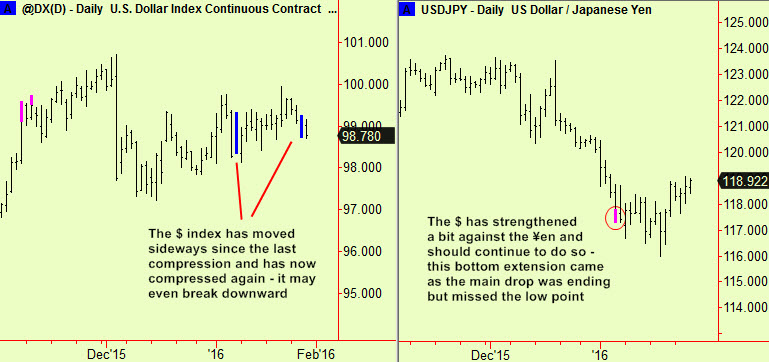
We wrote in the January 13th edition that the market expected a generally stronger $ but that our work showed it to be compressed, waiting for a break in either direction. This first chart shows that it still is. There has been no closing break of the initial compressions since then and now we have another compression so the market is still poised to jump. We still cannot tell which way. The second chart shows that there has been some small $ move up against the ¥ but this is more likely to be the ¥’s extreme weakness due to very aggressive QE than any innate $ strength.
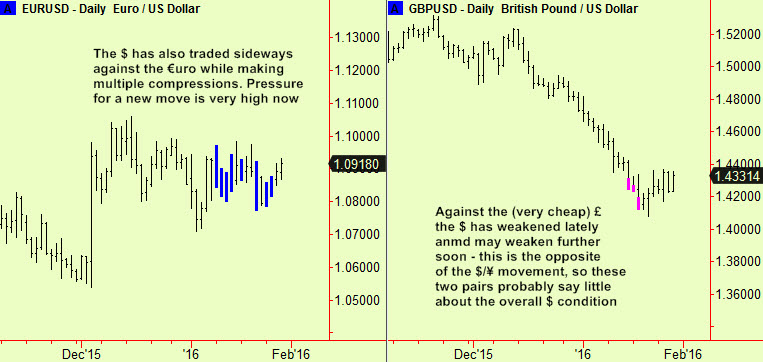
In Europe, the $ has also traded sideways against the € since early January, as shown in the next chart. This pair has made multiple compressions over the last three weeks, so a move is coming soon. Meanwhile the £ has strengthened against the $ which probably just tells us that the £ was over-sold after quite a prolonged down trend. We bought it.
This is quite confusing so a longer-term look at the $ itself may help. One reason why the market’s expectation of a strengthening $ has been disappointed is that the $ already went up over 20% when the ‘competing devaluation’ argument became popular. Our longer-term analysis signals reflected this as a monthly-scale compression occurred when the move was poised to start and it ended with a top extension at the same scale:
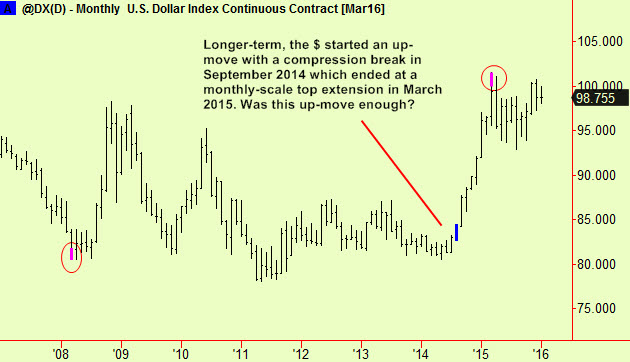
That long-term top extension led to the present trading range and the signal is now ten months old. Signals start to wear off after about that time and although they last an average of 15 periods or so, there is some variation around that figure. The time for the next $ move is approaching fairly soon and a break of the shorter-term compressions reported above will be the first clue as to its direction. This monthly-scale top will not act much longer to restrain it from being an up-move.
We will watch and report further.


