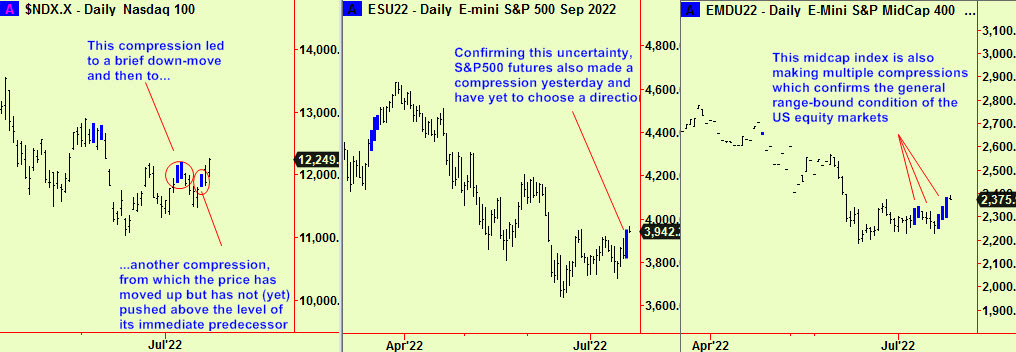
We reported in the last edition that US equities had made compressions. This means that markets are poised on a ‘knife-edge’ from which they can push in either direction. Various US indices are still making those same signals, so the whole market remains range-bound, awaiting a break one way or the other. That break is imminent and here are some updated charts:
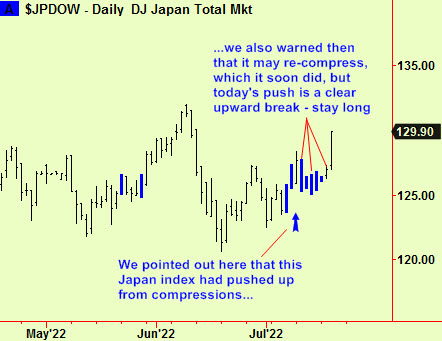
Meanwhile in that same last edition we reported an upward break of a compression in a Japanese index that we follow. We thought then that it might re-compress, so advised not to risk much on a long position, and it did indeed soon make several more compressions. The price pushed up strongly in today’s session to clear all these compressed levels, so we can now relax and hold on to those longs:
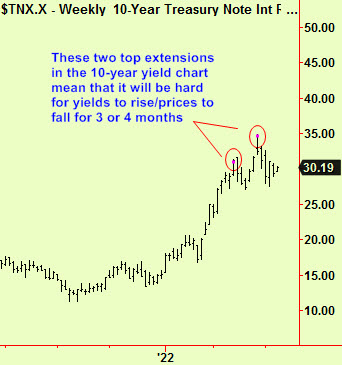
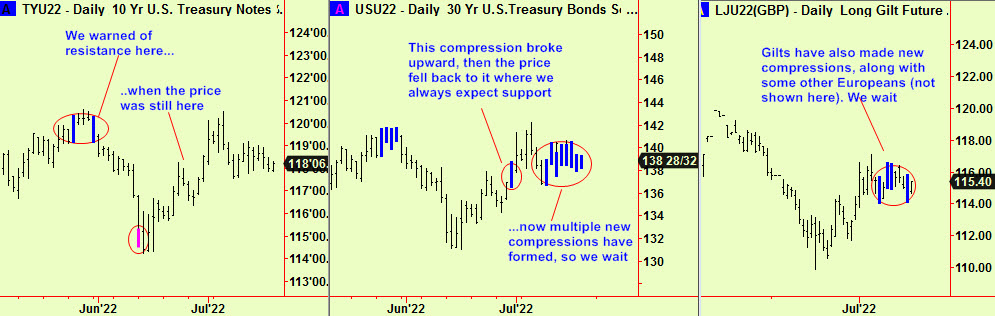
Bonds are also range-trading. We have been bullish since the second week of June, when top extensions appeared at a weekly scale in the ten-year yield chart:
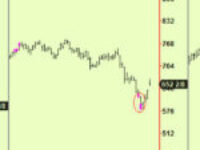
At the same time, daily-scale bottom extensions appeared (first chart below). We caught the first move up into early July and then called (in the last edition) for the dip to be supported at around current levels. Now prices have traded sideways and new compressions have formed. As ever we don’t know which way they will break, so we are sidelined for the moment. The weekly-scale signals in note yields shown above are still ‘in date’ so we still think prices will eventually rise but we will wait for these newer compression signals to break upward before acting. If instead they break downward, we will not follow that trend, assuming it to be a trap:
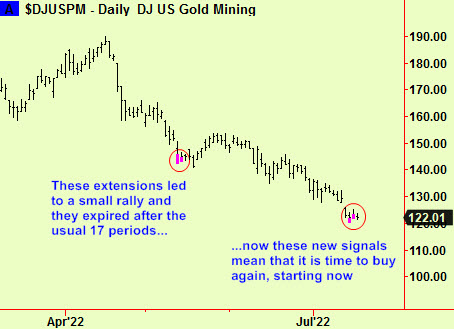
We have been surprised by the weakness in Gold. The drop has not (yet) produced a bottom extension, although conditions are getting close, but there have been a couple of signals in gold mining share indices. This is sometimes the only signal we get, so it is worth trying to buy some gold here. We may need to try a couple of times, so keep stops tight:
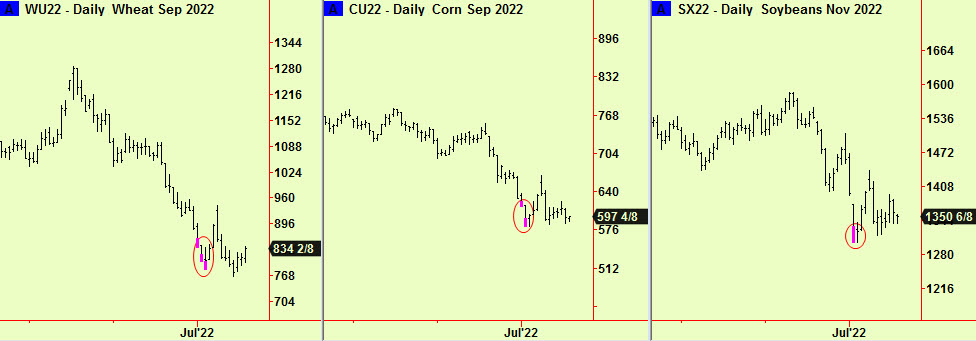
Lastly an update on grains. We reported that there had been bottom extensions across the Board, which had led to rallies. We advised buying dips; these signals are still ‘in date’; this is a dip – buy. These are the same charts that we showed in the last edition, updated:
All signals from software supplied by our friends at Parallax Financial www.pfr.com