
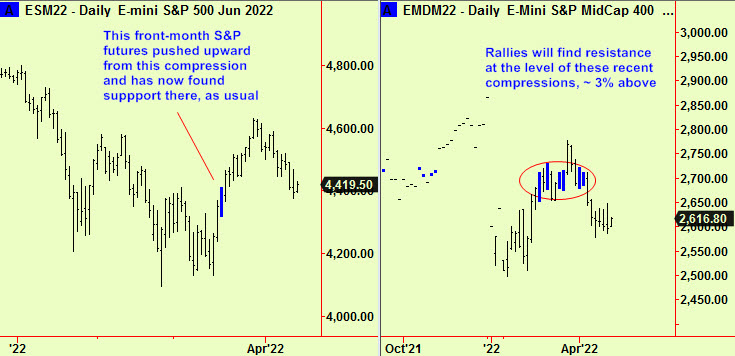
In the April 6th edition, we pointed out that US equity indices were dropping into support. That support comes from older compression signals and these are still being tested, as this S&P 500 update in the first chart shows. There is also resistance about 3% higher than current levels, from other compressions in the S&P 400 MidCap (second chart) so it looks as though the market will be bounded by these two levels until further notice. Trade accordingly – buying on support hereabouts and reversing into shorts at the resistance levels, when available. We have been sitting on the sidelines for some weeks here, but now we take one buttock off.
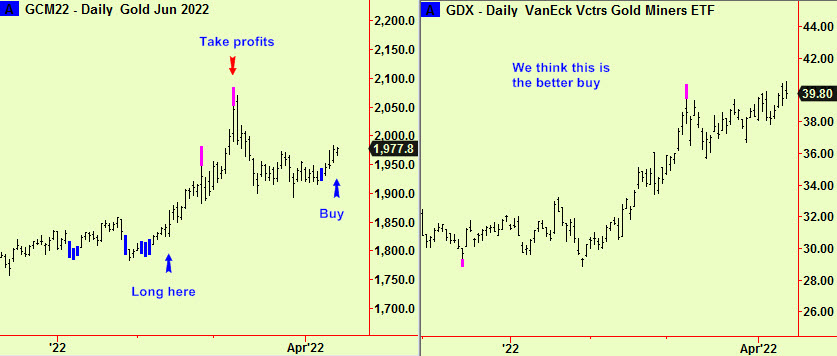
Gold compressed last Thursday and immediately broke upward onto a new trend. We liquidated previous longs after the market ran up strongly when Russia’s Keystone Kleptocrat invaded Ukraine. It looks as though there may be another ‘leg’ up in price now, so we advise re-establishing longs. There will probably be a dip back to the compression (there usually is, but its not inevitable – see $ index below) so it’s a bit of a trade-off – wait to get a lower price or risk missing the move…? We also note that indices of Gold mining stocks have out performed the metal. Of course they always have a higher ‘beta’ than the gold price, but in this case the big dip in the metal price was not matched by a big one in these indices. We are long of one of them and would recommend that as the way to play the move:
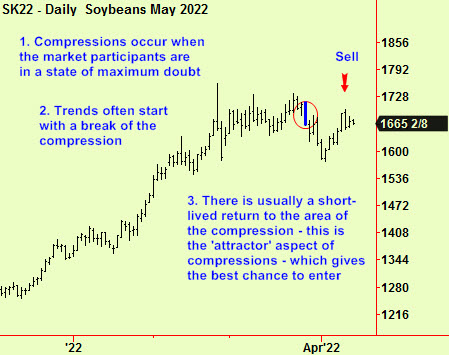
We advised selling Soybeans in the April 1st edition on a break downward from a compression. The price has since rallied back to that compression, so this is a second (and usually better) chance to establish a short. Stops may be placed a bit above the high of the compressed day, which was 1710 in the May futures contract:
Lastly, the $ index. This compressed and broke up, as reported in the April 1st edition. It has since moved up briskly with no dips and the internal structure of the array of Hurst exponents that we use to calculate extensions and compressions do not shown any danger yet. Stay long and we will advise:

All signals generated by software produced by our friends at Parallax Financial Research www.pfr.com


