
The various US stock market indices that we follow have been making compression signals for some time. Compressions indicate that the market is on a ‘knife edge’ when we usually adopt a neutral posture, waiting for the market to ‘tip its hand’. That happened last week, as the series of weekly-scale compressions in this Small-Cap index finally broke. In fact the break happened on Wednesday and Thursday, but we like to wait until the end of the week when looking at weekly-scale signals.
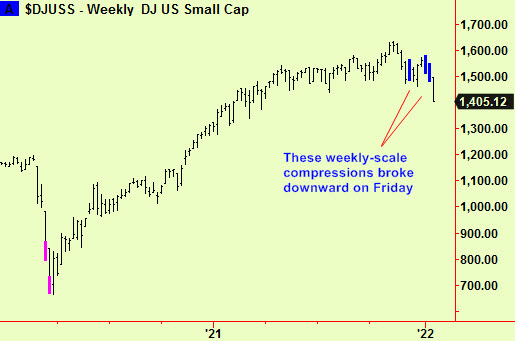
This is significant. New trends start at compression breaks and longer term trends start with breaks of longer-term compressions, so this weakness could/should last for several months. There will probably now be immediate follow-through in the form of more weakness and then it is usual for the market to provide some kind of bounce that will take prices back up to (or near) the broken compression – we often write abut this as the ‘attractor’ aspect of compressions.
That first ‘knee-jerk’ rally usually provides the best chance to establish short positions, but it is also usually fleeting. If you anticipated the break by selling the weak closes on Wednesday or Thursday, prompted by our reminder of a ‘big hole’ under the market on Wednesday stay short. If not, we will advise when we think it best to initiate a new short. Any rally back toward the lows of early last week in the next few days would be a suitable opportunity.
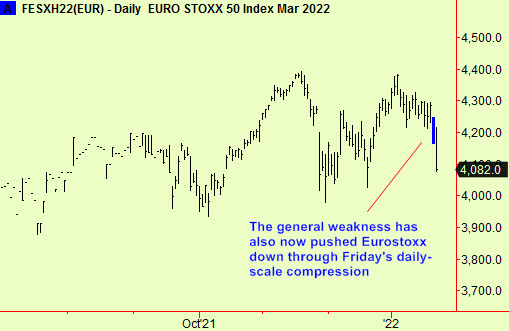
Naturally, the dominant position of US markets in the investment world means that others are falling too. This is also significant in the Eurostoxx index, which made a new daily-scale compression on Friday, from which it is breaking down today. This signal is so fresh that it is worth selling even small rallies today, despite our aversion to ‘selling the break’ :
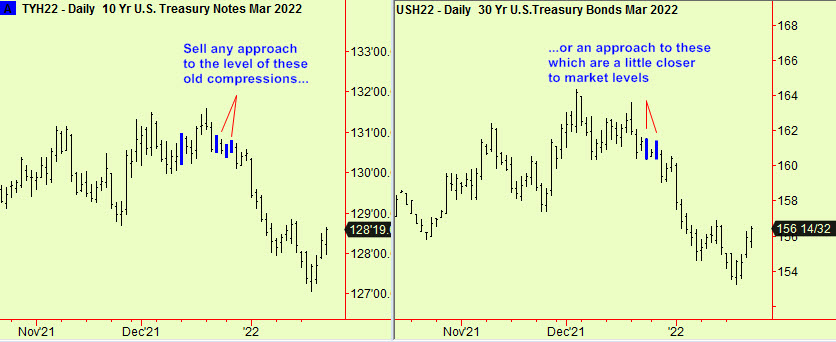
Bonds are naturally rallying in the inaptly-named but usual ‘flight to quality’. We wrote in the January 12th edition that we would be looking for a place to sell short US T-Bonds and Notes and this rally will lead to that place. The levels of the old compressions shown in these next two charts are what we would wait for:
All signals generated by software produced by our friends at Parallax Financial Research www.pfr.com


