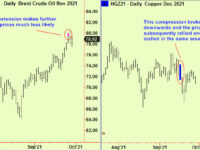
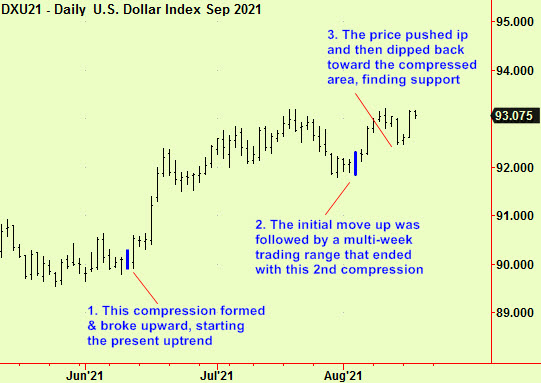
The US$ has been in an uptrend since a low point in mid-May. We identified this a few weeks later, in the June 11 edition, when a compression formed and broke upward. There has been no need to amend that advice and now there is fresh impetus to report. Another compression formed, broke upward and then provided support on a dip, as usual. Add to longs:
Stocks
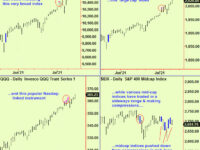
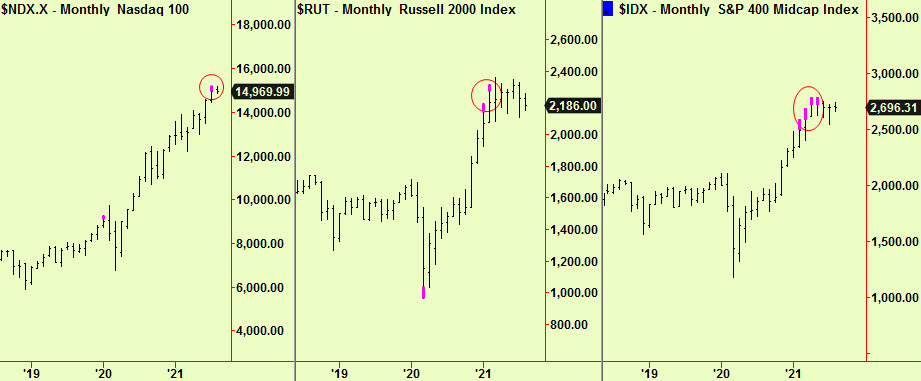
US stock indices have been mixed lately, with the Nasdaq, Midcap and small Cap indices trading sideways for 5, 18 and 28 weeks. The Dow and S&P 500 had pushed to slight new highs last week, before also dropping back down almost back to their recent ranges. We have no reason to change our advice to trade US stocks from the short side, as the downside risks still outweigh the upside potential here. The reason remains the same – some longer term top extension signals. These were at a monthly-scale and observed in several indices, 3 of which are shown below. Prior uptrends stalled at these extensions and the current trading ranges then began:
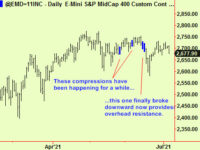
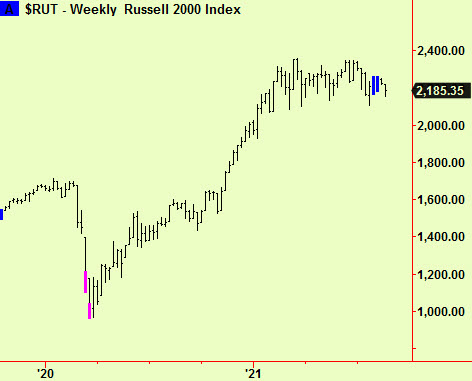
We often point out that uptrends tend to end at top extensions but there is usually a period of sideways ‘churning’ that ensues, during which a ‘top’ can form. Such churning then typically ends with a compression signal, which may then break downwards, signifying the start of a down trend. More recently there have been exactly such compressions forming at a weekly scale in the small-cap end of the market. It is too early to tell if the market is breaking down from these signals, but it is worth paying close attention for the rest of the week. Here is one example:
All signals provide by software developed by our friends at Parallax Financial Research www.pfr.com