
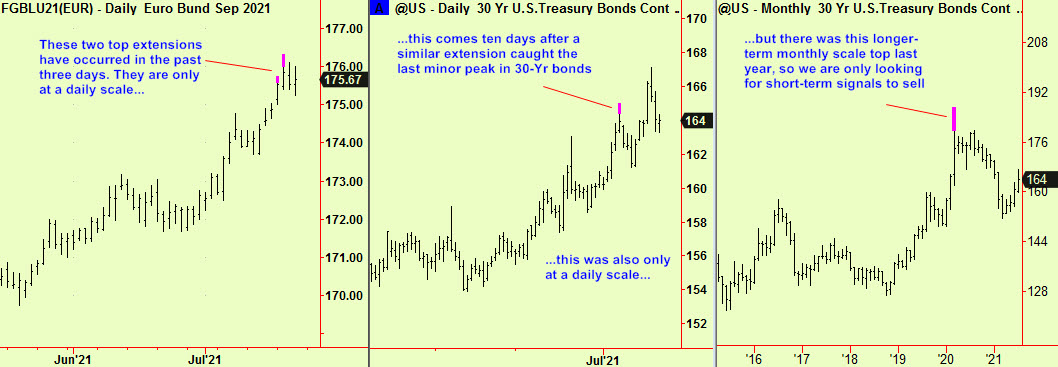
We wrote an edition on April 20th about the long-term prospects for government bonds. You can re-read it here. In it we said that we would be looking for places to trade with the new trend – that of rising yields/falling bond prices. This is one of those places.
We have just seen top extensions in German Eurobunds, the most important of the slew of European government instruments. This comes soon after a similar top extension (at the last minor peak) in US Treasury bond futures. This signal is still just about ‘in date’ and so means the two most watched bond contracts in the western world have both made top extensions within an existing downtrend. Sell:
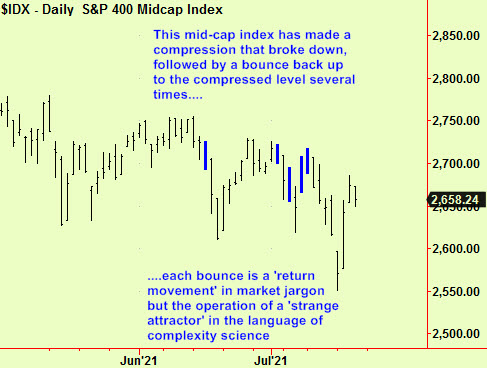
We have advised trading from the short side in US equities, based on a series of signals that started with longer-term top extensions some time ago. This came into sharper focus with some daily-scale top extensions in the S&P, Dow and Nasdaq together with compression signals in the laggard midcap indices, which then broke downwards. We often point out that market moves tend to end at extensions, but begin with compressions, which form and then break one way or the other – we can’t tell which way in advance.
The midcap has thereby ‘led the way’, which is not unusual – we often get signals in the less-examined instruments, which then provide clues to the overall market direction. Now that market index has rallied back up to the level of those compressions, which regular readers will know is quite normal and which provides another chance to sell, with quite close stops just above the upper edge of the compressed area. An update:
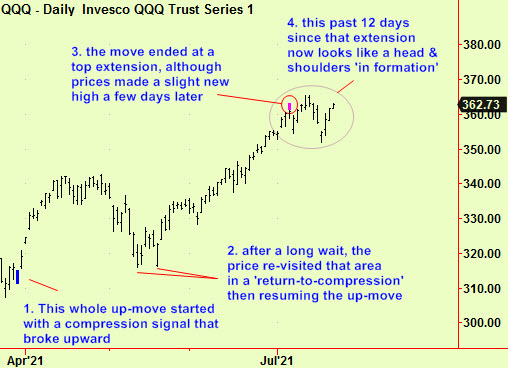
Lastly, an attempt to reconcile our methods with those of traditional technicians: We don’t look at patterns in price, we look look for patterns in the underlying market dynamic. Occasionally, a traditional chart pattern is so obvious that even we can spot it and it is usually during the formation period. Typically, we see top extensions at the end of a market rise, just as the price gets ready to stall. After that, prices usually ‘churn’ for a while and some kind of ‘top’ may form. That may be happening now in various Nasdaq measures. Here are the QQQs:
All signals provide by software developed by our friends at Parallax Financial Research www.pfr.com


