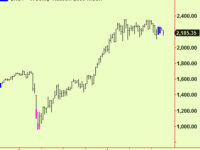
In the last edition, dated June 21, we pointed out that the S&P 500 and the S&P 400 (the ‘mid-cap’) were behaving differently. The 500 was re-visiting support from an old compression (1st chart below) while the 400 had broken downward from a new compression (2nd chart) that would now provide resistance on a rally. The Dow (3rd chart) has been behaving like the 400, which is an unusually divergent situation.

compression in the 400 is providing resistance.
It is usually foolish to sell new highs in any market, unless the feedback loops that lead to self-sustaining trends are getting very tight. When that happens we get an extension signal, but we do not have one at a daily scale in the S&P500. We have such signals at weekly and monthly scales, as already reported several times, but these do no help much with ‘timing the top’. For now, we advise selling any long positions in US equity indices and trying a short-sale in the mid-cap futures and/or Dow futures. If we see a reason to adopt short positions in other indices, we will say so.
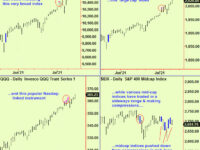
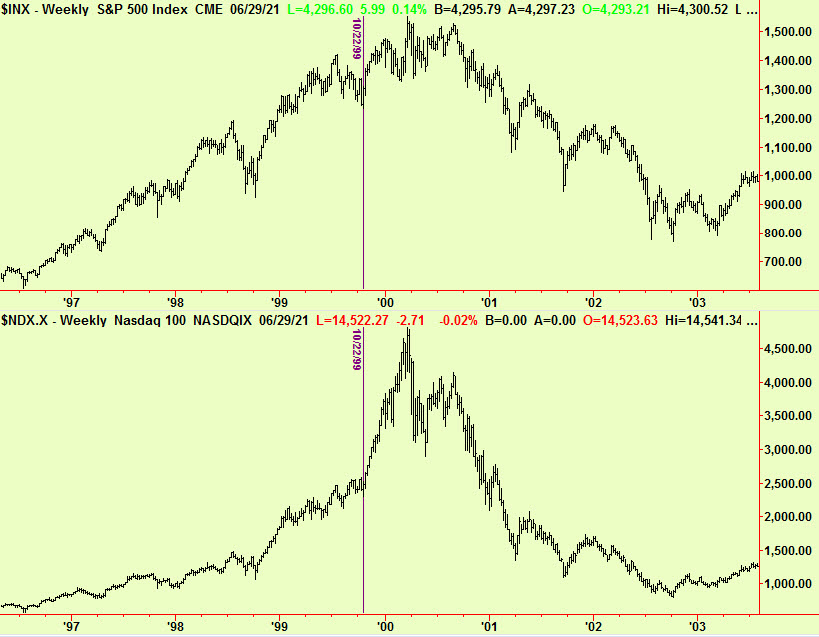
Meanwhile, it is useful to remind readers of the way in which the last big bubble unwound. The ‘tech stock’ boom today is similar to the ‘dot com’ bubble of the late 1990s. The point of this banal observation is to show what happened in the final few months in 2000. The broader indices reached a high point in late July 1999, following which the whole market ‘churned’ until December the following year, making occasional slight new highs but then falling back into a broad trading range. After three months of this, the Nasdaq 100 index started to move higher and then almost doubled in value over 5 months before making a ‘spike’ top in March then starting a decline that wiped 80% of its value. The vertical lines on these two charts are placed on the same date in late October 1999, as the Nasdaq began that final rise:
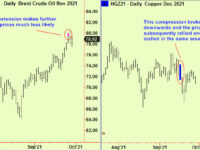
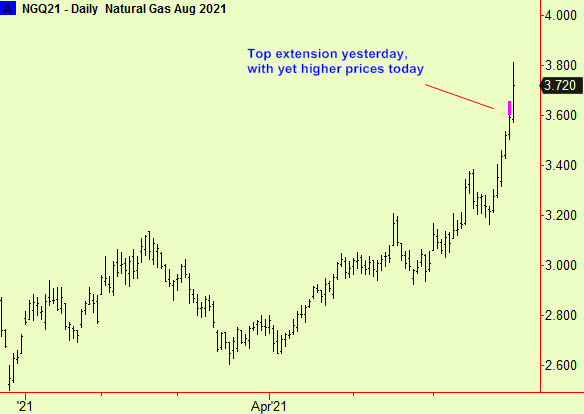
Elsewhere, Natural Gas futures have been rising at a quickening pace and there has now been a top extension. The rise has become steeper in the last few days, so it is dangerous to sell short in the face of such an exponential curve. Be prepared to do so however, on any signs of reversal, as this will probably be a ‘spike top’. Under no circumstances should you sell the front month, as ever when selling commodity futures, because a short-squeeze can take nearby prices to undreamed-of levels. The market is in a normal ‘contango’, however with forward months trading a little higher than nearby, so choosing a delivery month in early 2022 is no sacrifice:
All signals provided by software developed by our friends at Parallax Financial Research www.pfr.com