We were long-term bulls of China and Japan from May 8th 2020 until January 18th 2021, when top extensions appeared at a weekly (and then monthly) scale. Here is an update of the weekly-scale picture:
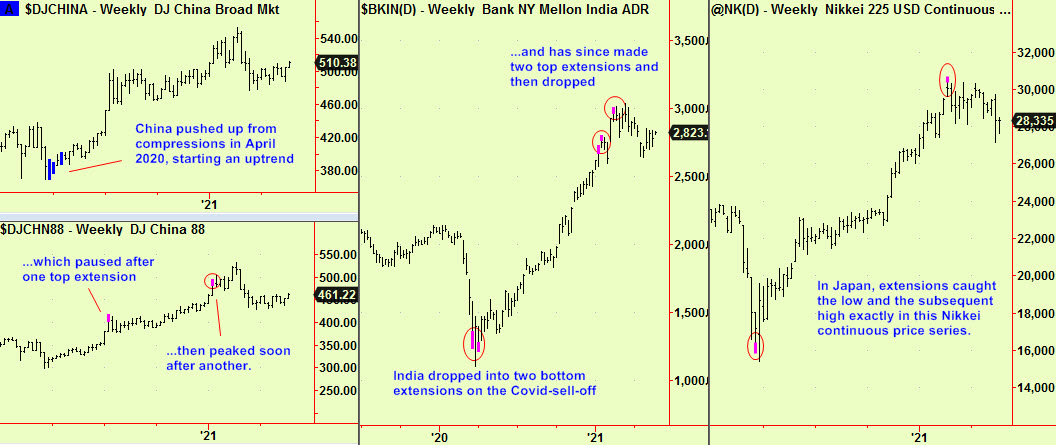
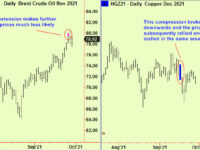
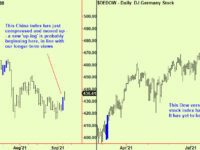
These weekly (and monthly – see February 1st edition) tops mean that any rally will not travel far or for long. This is similar to the situation in energy markets, where there have also been weekly-scale top extensions, but prices have moved up from daily-scale compressions. Rallies will still occur of course and there seems to be one developing in Asian equities. One of the mainland China indices has just pushed up from daily-scale compressions and a Singapore index is bouncing from a bottom extension:
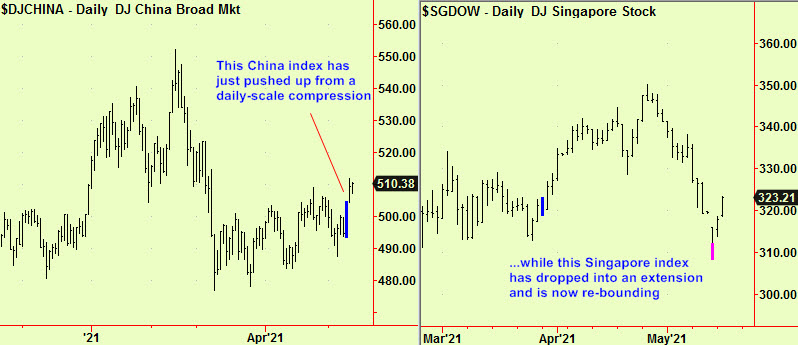
We do not like to ‘buy the break’ when prices move out from a compression as there is usually a return to the area of compression before a new trend can really begin, but the risk of buying this one seems small. These signals last a median of 17 days after they form, so keep trading here from the long side for another two weeks.
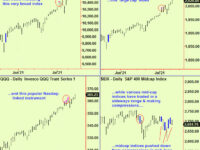
US equities dropped and the Nasdaq pushed about a third of the way into the area of support we have been writing about, between 12984 and 12776 in June Nasdaq futures. The low of the drop was 12915. US stocks have now bounced and the situation has become cloudy, as fresh compressions have formed. Neither of these new signals is in the most liquid ‘front month’ but we often get signals from less-observed instruments:
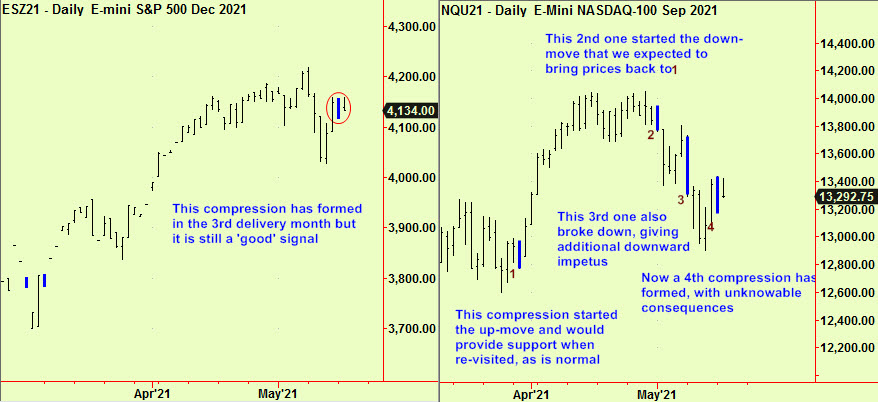
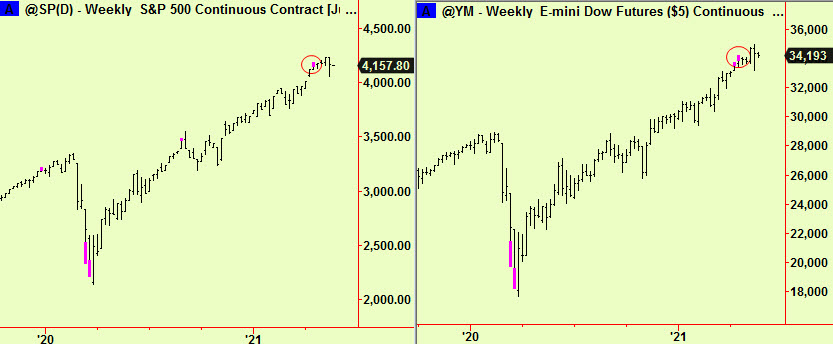
We often remark that compressions are moments of maximum uncertainty, akin to a knife-edge. We rarely have an opinion abut the likely direction of the eventual break, although some new trend is likely in the immediate aftermath of any compression signal. We prefer to wait for the break and then wait again for the price to revisit the area of compression before entering a trade, although this can be frustrating. In this case we have a slight preference for a downward break, because both Dow and S&P futures made weekly-scale top extensions in the past few weeks, as ringed below, which will tend to ‘cap’ any rallies for a while. This opens the door to potential down-moves:
All signals provided by software developed by our friends at Parallax Financial Research www.pfr.com