US indices are still divided. The rally of the last few days has pushed the S&P 500 and Dow to new highs in the last few days while the Mid-cap is still a little below the highs made in mid March and the Nasdaq has not yet challenged the highs it made in mid February. That will probably change soon as the Nasdaq 100 broke up from a daily-scale compression just before the Easter weekend, and it has held those gains so this looks like a new trend. This also pushed prices through the ‘stop-loss’ level that we advised in the March 19th edition to stop trading from the short side.
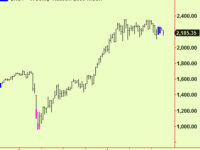
In Europe, the Eurostoxx has made a daily-scale top extension, which argues that the rally will stall hereabouts. This probably reflects the efficiency with which the US is now vaccinating against Covid vs the appalling current Eurofumble:
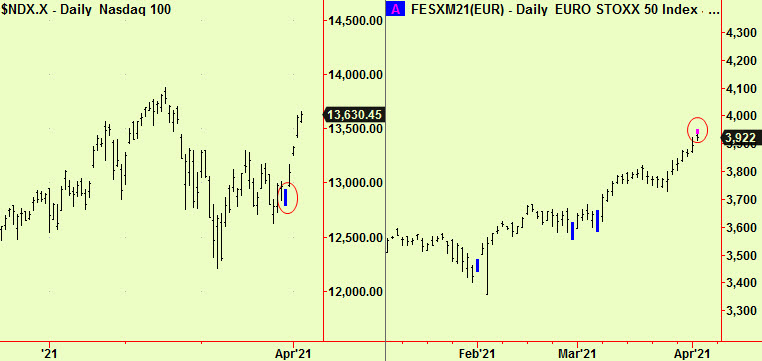
The usual pattern of events when a compression breaks into a new trend is for the price to ‘run on’ a bit in the direction of the break (upwards, in this Nasdaq example). Soon a contra-trend reaction then sets in and the price dips back toward the level of the compression signal. The the trend resumes. This gives a second chance to place a trade in the direction of the trend by ‘buying the dip’. The high of the compression in Nasdaq futures (not shown here – only the cash index compressed) is 12984, so buy any dip toward that level.
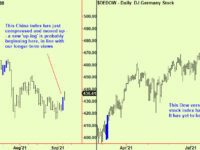
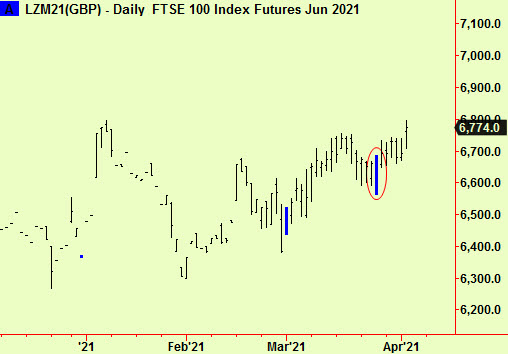
There is an equivalent situation in the FTSE, the UK’s main traded index, where a daily-scale compression has also just broken upwards. This index hasn’t travelled far yet, so it is worth buying now, rather than waiting for a dip. The UK has also done a good job of vaccination, and markets may see success or failure in this area as the main reason to buy or avoid share indices :in the next phase:
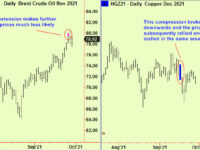
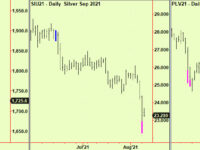
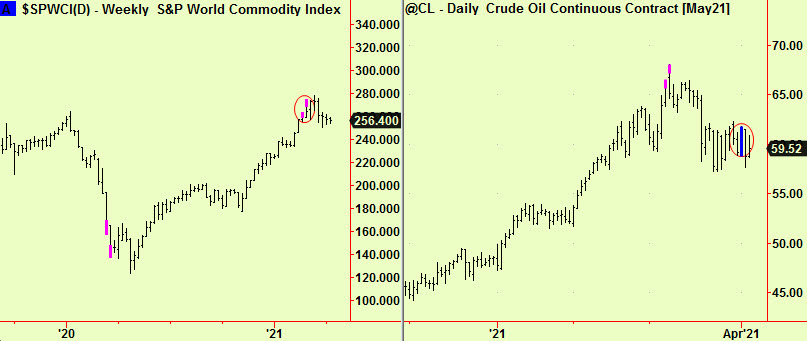
Elsewhere, the commodity indices that we follow have been trading sideways in a narrow range since the top extensions reported on March 15th. These marked the top of the rally (so far) and we advised to expect this period of ‘churning’ as a possible ‘top’ formed. There is an updated chart below with the weekly-scale top extensions ringed. Next to it is a new chart of WTI crude oil, which is a substantial component of most commodity indices, showing a daily-scale compression that has formed recently. When this breaks, a new trend is likely to start in the direction of the break. If it is downwards (which we think more likely) the price drop could be $10 or more.
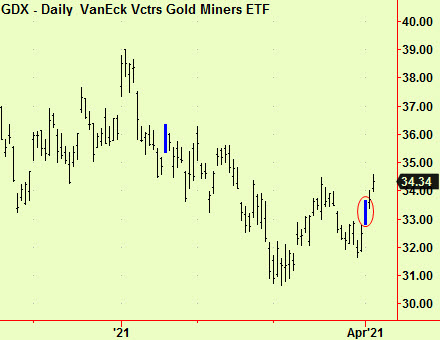
Lastly, there has been a compression that has also broken upward in an index of gold mining companies. This should also be bought, and probably Gold futures too: