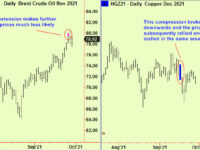
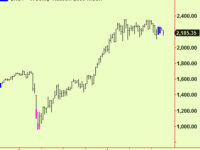
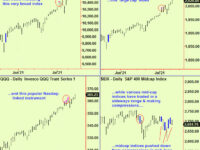
Three US indices have made top extensions at a daily scale in the last 2 trading days. This comes after a brisk rise from some compressions reported in the last edition and probably signals the imminent end of this ‘leg’ up that started from those compressions.
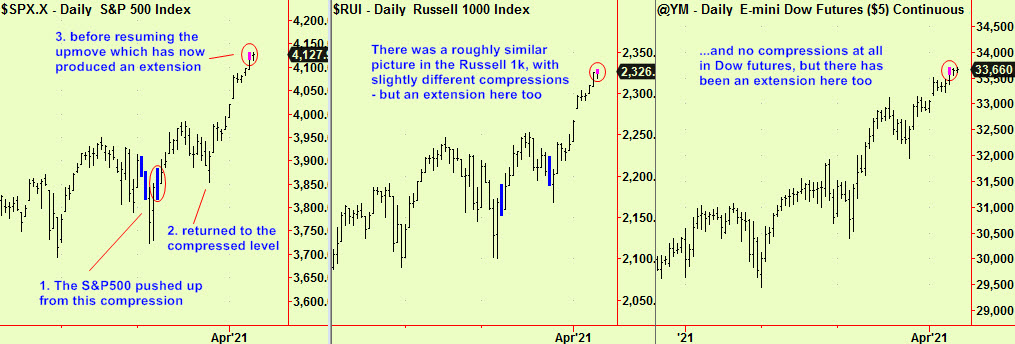
The most likely outcome will be a dip starting from hereabouts that will take prices back down to the level of the most recent compressions, as is normal. When a trend starts from a compression, there is usually a return-to-compression that occurs before the trend resumes. The top of the Russell 1000 index compression (middle chart above) is at 2222, about 4.5% blow here. Expect a dip toward that level and buy it.
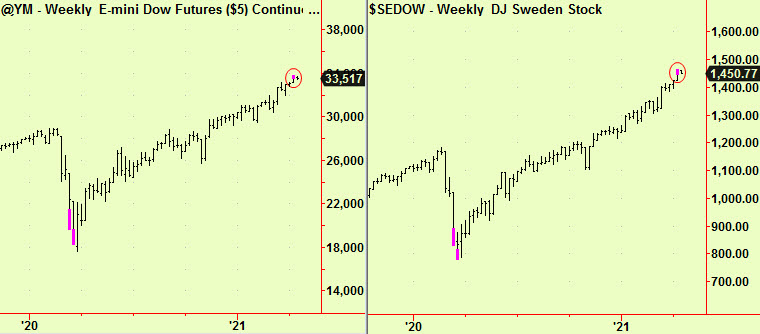
It won’t be plain sailing from there on though, as there have also been weekly-scale top extensions, in the US and some Scandinavians:
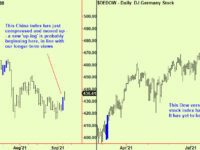
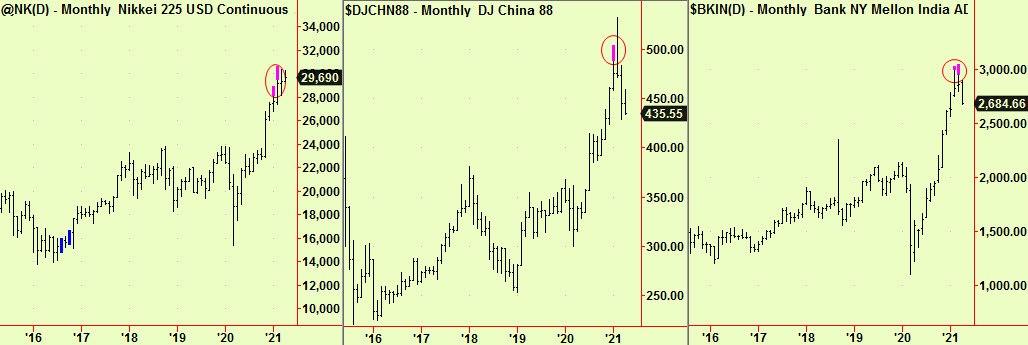
There have also been monthly-scale tops in Asia’s ‘big three’, as reported in February, which stalled (and probably ended) their up-moves, especially in China which has fallen 19.4% from high to low-of-dip so far. Here’s an update of the charts we published in February:
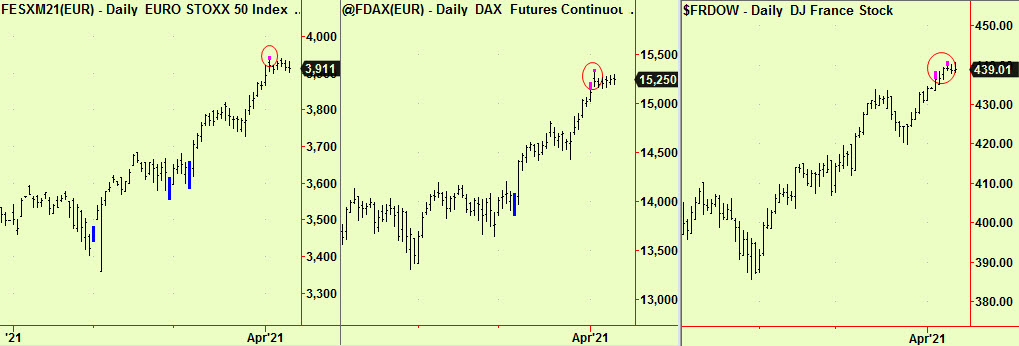
All this means that stocks, which have almost been discounting the coming of a new messiah, are on thin ice. Asian indices have already stopped rising and will probably enter a bear phase, after some ‘topping’ occurs. It is quite possible that this is already underway but ‘spike’ tops are unusual so we expect some sideways ‘churning’ before any chance of real weakness. European indices made daily-scale tops last week (as reported) and that has stalled their up-moves for now, with at least another week to go before those signals start to fade. Here are the Eurostoxx, Dax and a Dow version of the French equity index to provide an update:
That leaves the US and UK which are both expected to experience vigorous economic growth as their successful vaccination programs enable some loosening of the straitjacket of lockdown. We don’t usually consider economic prospects when analysing markets but the choice between investing in the EU and in the Anglosphere seems unusually clear at the moment.
In the US there is support about 4-5% below present levels and we would cover any shorts and buy long on such a dip, expecting a further rally that could travel quite far. Notwithstanding that view, we don’t regard stocks anywhere as a ‘strategic hold’ from here and so we would confine activities to trading-in-and-out. We will do our best to ‘call the turns’, as usual.
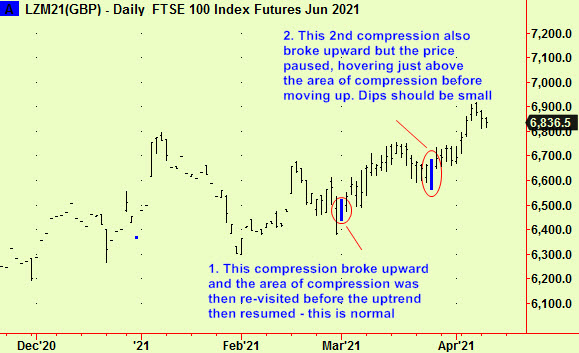
In the UK’s FTSE index, there was a compression that broke upwards (update below) and we would ‘buy against’ this as support. As the caption in the chart says, the manner of this break is relevant and this market may just climb higher with only small dips – it may not re-visit the area of compression:
It is worth re-stating here what compressions really are and why they behave the way they do. In all complex systems where interactive feedback is a main influence (weather, disease spread, evolution, markets etc) then ‘attractors’ are a common feature. In this situation, feedback is predominantly negative, so the feedback loops that form continually reinforce the status quo. In markets, this leads to trading ranges or so-called mean-reverting behavior and this can persist for a long time and the value being measured (price, in markets) doesn’t move far and will often gyrate in repeating patterns – this is called an ‘attractor’ as values seem drawn to the same area, for no reason that the eye can see – feedback is invisible, after all.
A further consequence is that when the situation changes and the price is suddenly ‘flung’ into a trend, the attractor keeps attracting for a short while more. In markets, that means the trend begins with the compression break but the price will then re-visit the area of that attractor one more time (or very occasionally twice). This happens so frequently that it has become a rule that we follow – don’t buy the break, buy the return. The same is true in reverse for selling, if the price breaks downward.
Our next edition will comprise a bond market review.
All signals provide by software developed by our friends at Parallax Financial Research www.pfr.com