There has been much debate about the next direction in bond markets. Some think that an uptick in inflation is imminent for a variety of reasons, including the planned extra fiscal stimulus to a US an economy that is already running hot and an impending surge in demand from around the world as Covid vaccinations reduce transmission rates. This would apparently cause bond yields to rise, despite there having been no obvious link between bond markets and reality since the days of Alan Greenspan as Fed Chair. He mused then about the ‘conundrum’ of persistently low yields no matter what economic weather prevailed. Glut of savings? Emergence of China as a low-cost factory to the world? There was (and is) no obvious explanation.
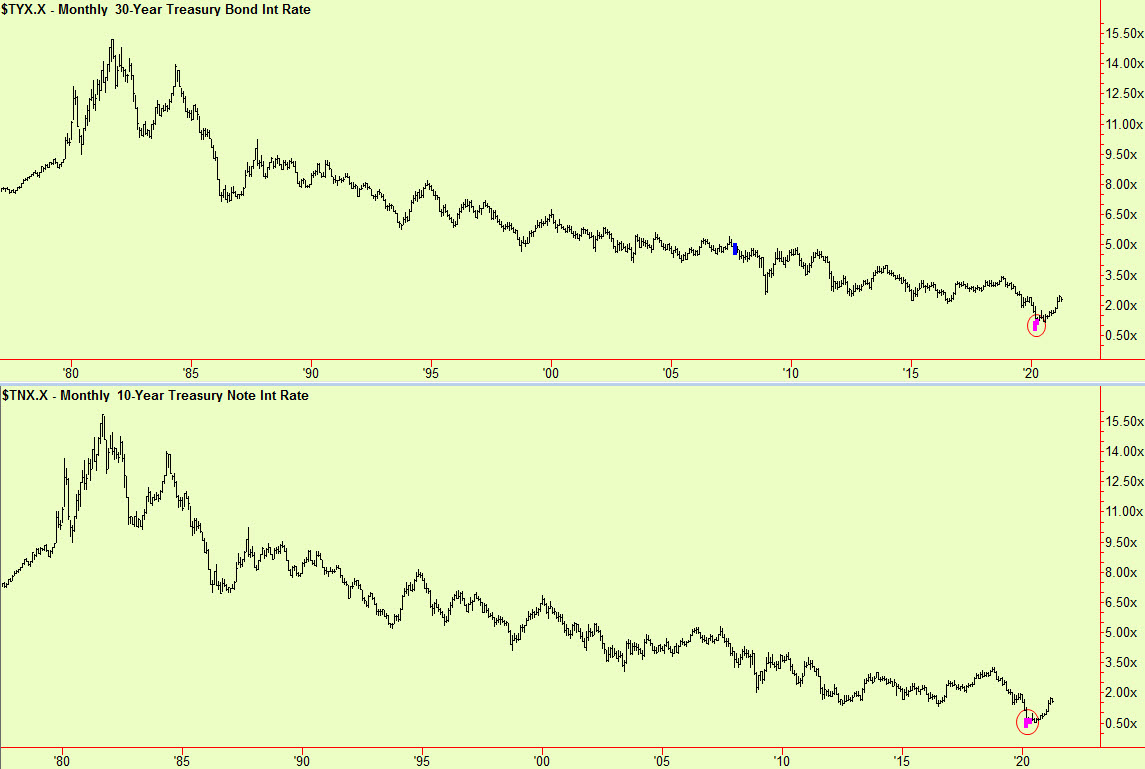
Let’s start with a long view. This is the ten-year US Treasury yield since the 1970s. The real drop in yields (i.e. the rise in prices) started in 1987 with the stock market crash of October (ringed) even though a higher yield (of 16%!) was reached in the summer of 1981:
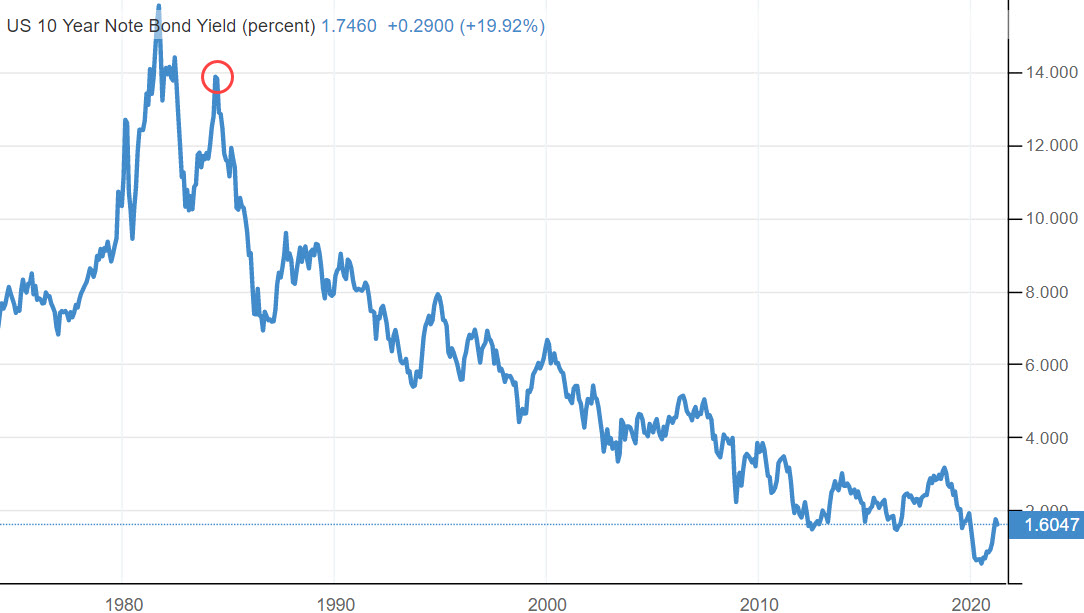
Elsewhere, a zero yield has not provided any significant barrier to more weakness. The Ten Year German Bund yield over a similar period (with a currency switch from Marks to Euros in 1999) shows a similar decline BUT the yield first pushed below zero in 2016 and stayed below there for the last two years, as shown by the red line:
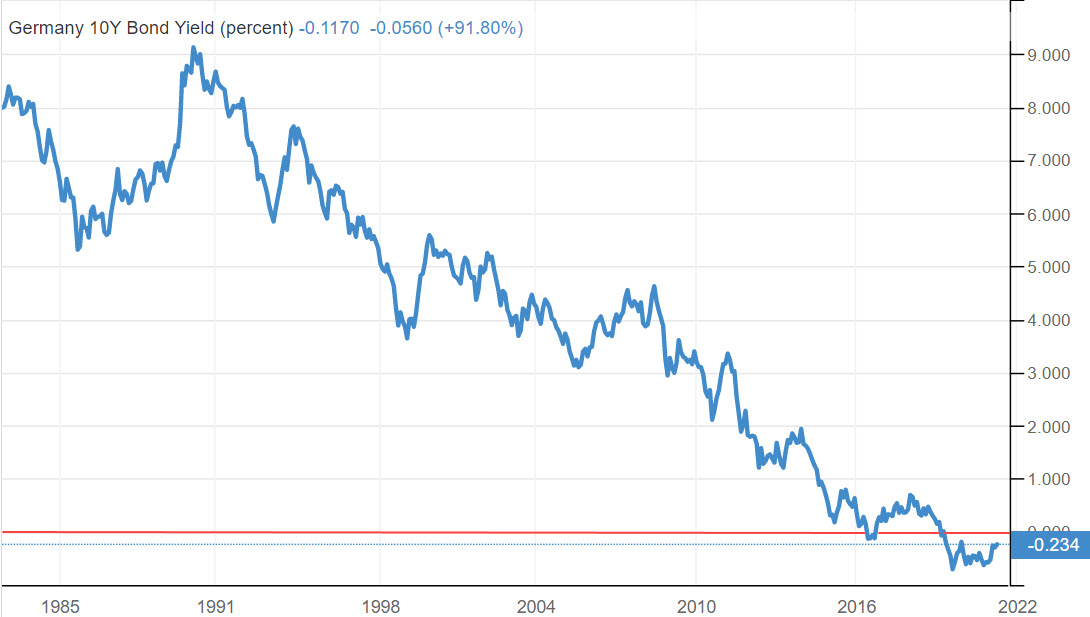
So, the decline in yields has persisted in a well-defined trend for over 30 years, and there is no effective floor. Many attempts have been made to ‘call an end’ to the decline and all have failed.
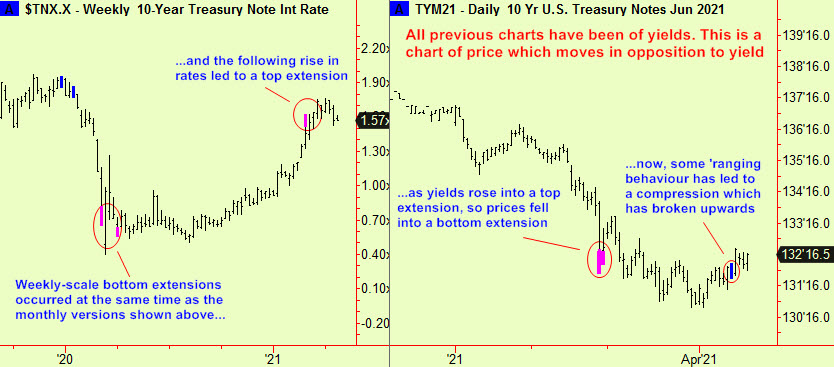
This time it may be different. Our complexity theory-based signals have produced monthly scale bottom extensions in both US 30-year bonds and 10-year notes for the first time in this whole decline:
This shifts the odds sharply in favour of an end to this long-term downtrend in rates/uptrend in prices. It is even possible that there will not need to be a lengthy period of sideways activity before the opposite trend sets in. We will be looking for points of entry to trade from the short side of US bonds for the foreseeable future. In the meantime, it looks as though there will be a setback in yields/dip in prices, which will led to exactly such an opportunity in a few weeks:
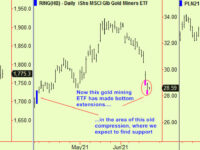
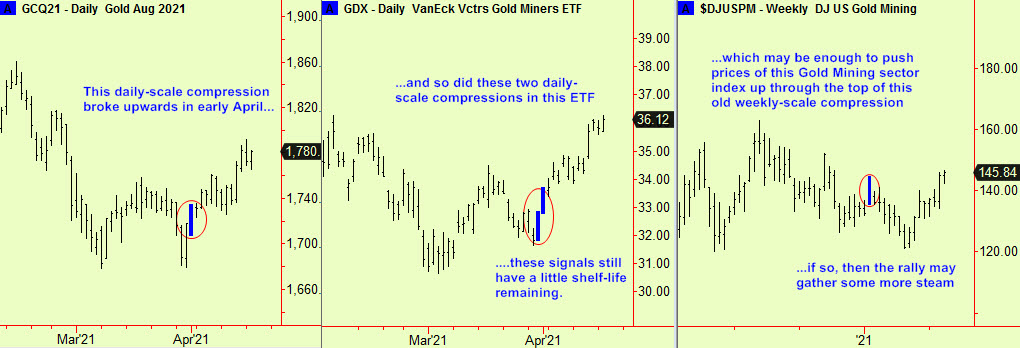
Gold prices have been moving up, preceded by a couple of compressions that broke higher, as advised in recent editions. Here is an update to the story, chart-by chart.
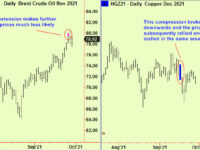
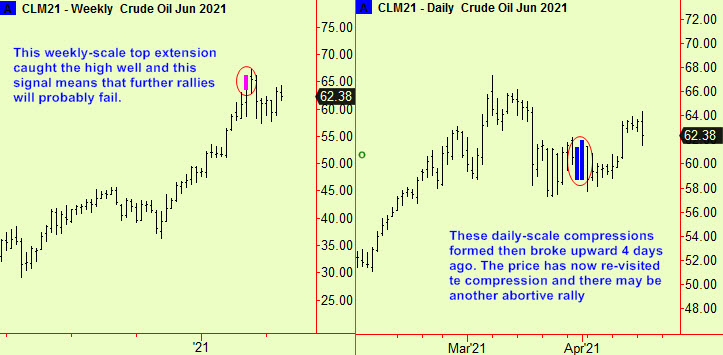
We have reported that energy futures contracts have been compressing at a daily scale, after making weekly-scale top extensions in the early Spring. Those weekly top signals make it very difficult for rallies to travel very far, so we guessed that the daily-scale compressions would be more likely to break downward. If they did, we estimated that crude oil could drop by $10. The compressions broke upward instead (we never know which way they will break until they do) and found support at that compressed level today, on a dip. Here is an update. There will probably be another rally starting here, as moves out of compressions usually consist of an initial break; a revisit to the area of compression, then another move in the direction of the break. The weekly signal will continue to inhibit any sustained rally.
All signals provide by software developed by our friends at Parallax Financial Research www.pfr.com