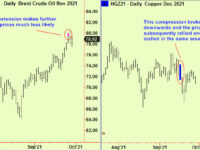
We have been sceptical of the prospects for more commodity strength. Here are the reasons, in descending order of time frame. Firstly, at a monthly scale, where bottom extensions in Spring 2020 signalled the end of the big drop. Since then, prices have staged a brisk rally, which we think will now stall:

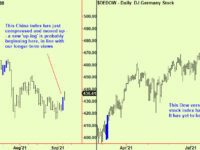
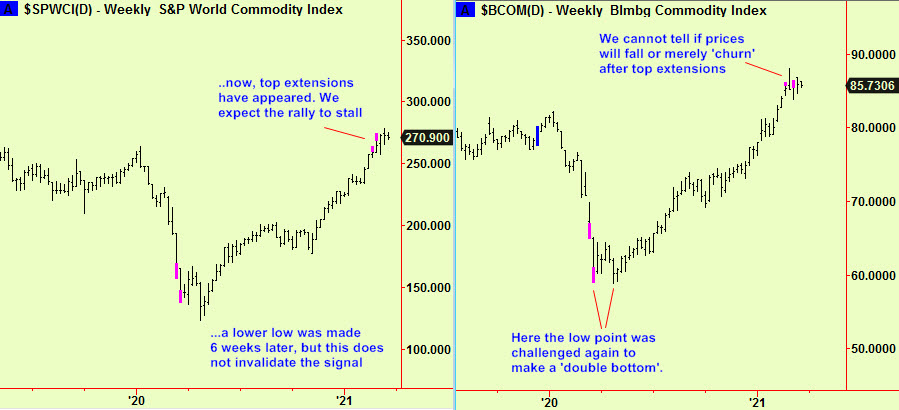
Next, commodity index signals at a weekly scale, where top extensions have been occurring. These often signal the beginning of a ‘top’ but this is usually a process that takes a while to complete; perhaps it will need a few weeks more.
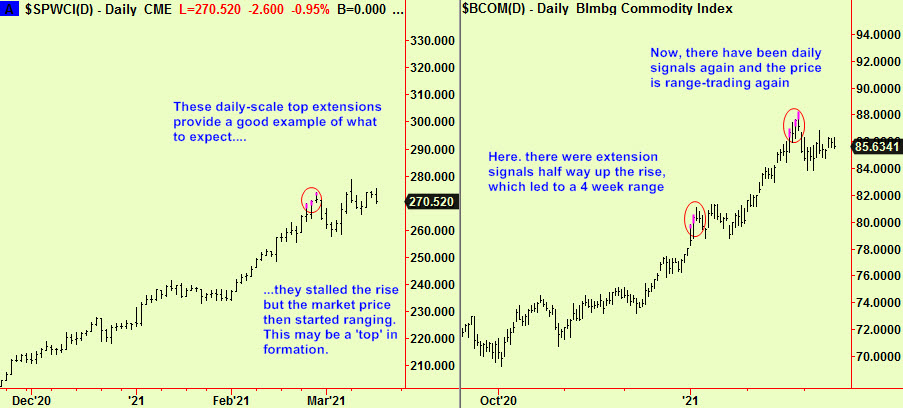
Lastly, some top signals at a daily-scale that occurred in late March. These have led to a ‘churning range’ that we think is likely to mark the formation of a ‘top’.
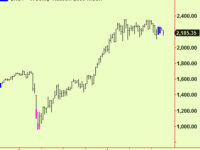
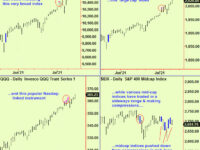
Meanwhile, US stocks have been rallying. This has led to a continuation of the trading range in the S&P, an interruption in the downtrend in the Nasdaq and new highs in a continued uptrend in the Dow. This divergent behaviour is unusual and highly unlikely to continue for long:

This odd period started with some top extensions in the Russell 2000 and Internet indices, as reported in the February 10th edition. We have also reported that Asian stock markets have made top extension signals at weekly and monthly (!) scales, so we are anxiously scanning for fresh clues in the US. Until we get some new signals, we are sticking with our advice to keep trading from the short side, but to cover some on dips and re-sell on rallies to maintain an overall short posture. This has worked well for over a month and those longer-term top signals in Asia may well precede some more serious weakness in the US (and by implication, European) equity markets.
All signals provide by software developed by our friends at Parallax Financial Research www.pfr.com