
We pointed out in the November 26th edition that crude oil was pushing up from a weekly-scale compression, meaning that a new uptrend had started. Price had already moved fast enough, far enough by that date to generate daily-scale top extensions in crude and in heating oil and our conclusion was that more strength was coming but that prices would first pause or dip. They paused, resumed the uptrend and now there have been further daily-scale top signals. Here are the same charts from that November 26th edition, updated and with new commentary:
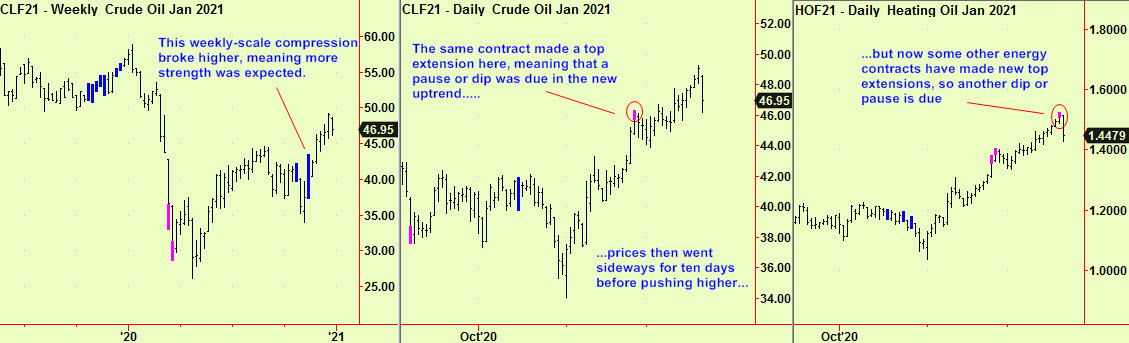
The conclusion is similar – there is a strong likelihood of another dip or pause in the current uptrend. That uptrend has been in train for only 4 weeks since the compression broke upwards and started the ball rolling, so it has plenty of life left in it – perhaps another two months. Keep buying dips and get ready for one now. It is entirely normal for trends to have an early reversal in which the price returns back to the compressed area that started the trend. The price of crude oil for January delivery in that compression was $37.52-$43.33, so that is where good support will be found.
An illustration of this ‘return to compression’ has just occurred in Wheat futures. In the November 3oth edition we showed a new daily-scale compression in March futures, saying that if it the price broke downwards there would be support at the old weekly-scale compression shown in the chart next to it. It did break downward and the price stopped dropping half a cent from the compressed area. Here are the same charts, updated with new comments:
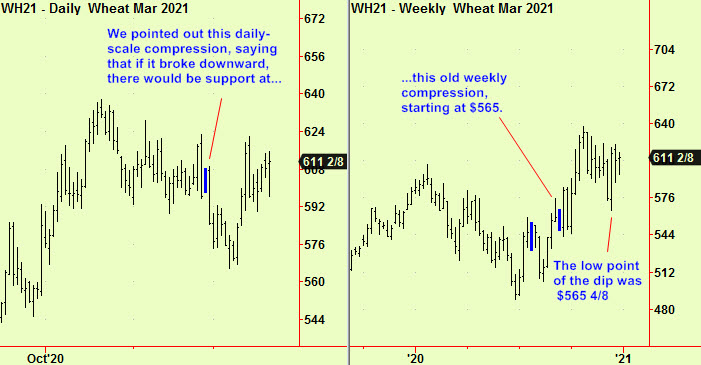
This probably means that the uptrend in Wheat has now resumed. We will comment further as we see things unfold.
This ‘return to compression’ phenomenon is a feature of almost all feedback-driven systems and is called an ‘attractor’ or sometimes a ‘strange attractor’ by the scientific community. Here is a link to the Wikipedia article and there is a lot more research that has been published on the topic, some of it by us.
Lastly, an update on US stocks, which have continued range-bound, as we have been advising. The signals that led us to this conclusion are getting too old to rely on further so we now set aside that advice and wait. Here’s the Dow signal that started the current phase:
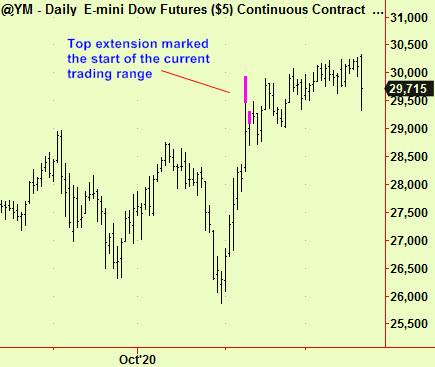
When a range forms like this, the start is usually signalled by a top extension, or less often a bottom extension. The range usually then continues for a whole, until a compression signal appears, which means the range is nearing its end and a break into a new trend is imminent. Nothing seen yet, but we wait and watch.
A Merry Christmas to all our readers,
Richard Edwards
All signals provide by software developed by our friends at Parallax Financial Research www.pfr.com


