
The recent steep rally in Copper has produced top extensions at both weekly and daily scales:
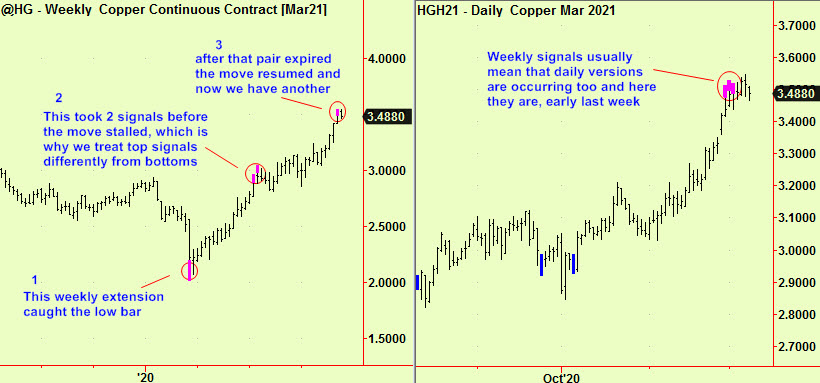
These have the usual meaning of a top extension – the upmove will end or stall hereabouts and a drop now becomes possible. ‘Spike’ tops are rare however and so the more likely outcome is a period of churning’ which can be when and where a ‘top’ forms. Before any weakness can ensue (or before the uptrend can resume) we would expect to see a compression form. It’s too early for that but the upmove has clearly stalled, so we wait. Trade the range if you wish but please don’t get wedded to any longer-term view yet.
The $ index has fallen lately, mostly because the €/$ pair has firmed. Both have now extended at a daily scale:
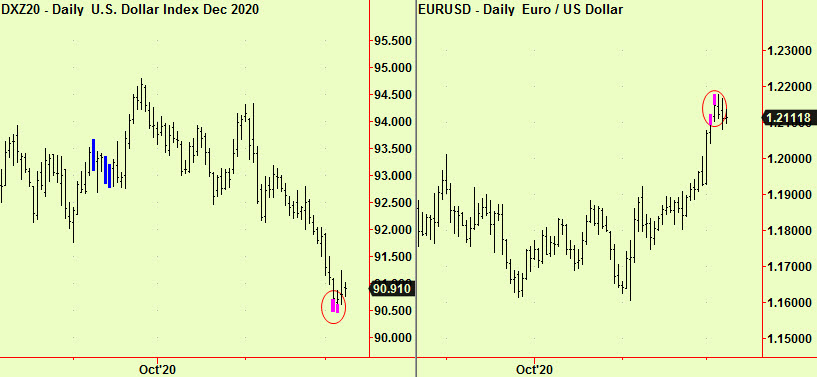
We treat currency extensions the same, whether tops or bottoms. Because currencies trade in pairs, a top is the reciprocal of a bottom and ‘V’ or ‘Spike’ turns are much more common. Accordingly, we always take a signal as an opportunity to trade soon after it occurs. Buy the $ Index/Sell the Euro/$.
Natural Gas futures extended on November 20th, as reported. It rallied for just over a week then fell to new lows for the move, where it has now extended again:
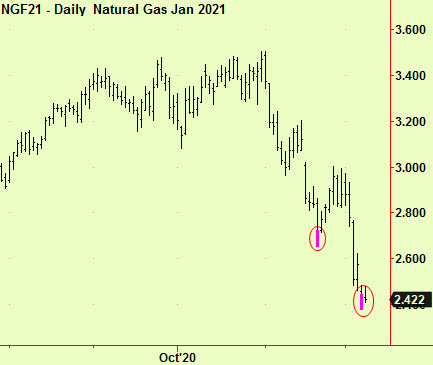
This is another chance to buy for a bounce (and maybe much more) so we would wait a shot while to make sure that this immediate weakness has ended and then buy any short-term sign of reversal to the upside.
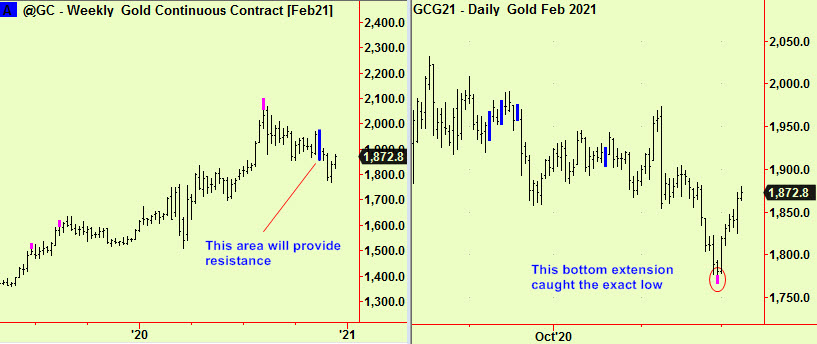
Gold has rallied over $100 a once since the bottom extension on November 30th. We remarked in that day’s edition that the imminent bounce would lead to another place to sell, and that seems to have happened. The price is now backmup into the area of a weekly-scale compression, from which it fell into that November 30 low point. This is where we expect resistance and so be very careful here. The resistance extends from 1854 to 1972 (current price 1874) which is a very broad band, so it is hard to be precise. We would take profits on longs and start to sell short. Here are the charts from the Nov 30 edition, updated:
Lastly, stocks. There is no reason to change the advice given in US stocks several times in recent editions. The main indices have produced top extensions at both weekly and daily scales. The daily version was in Dow futures (first chart below), which has now pretty much expired but there were also weekly versions in several Nasdaq indices. These are also getting a bit old (at 14 weeks) but we continue to think that this ranging behaviour will continue for a bit longer: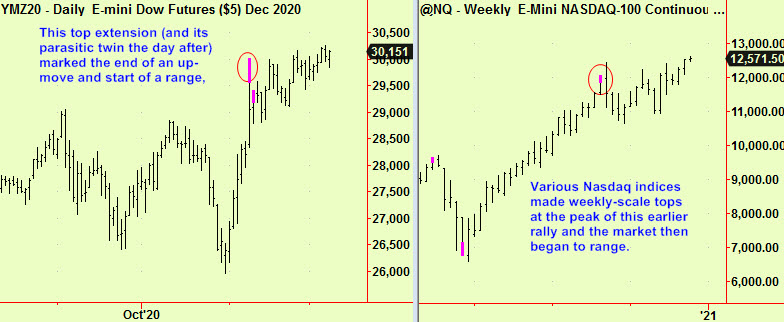
Al signals provide by software developed by our friends at Parallax Financial research www.pfr.com


