
There have been a few compressions in stock indices in the last 24 hours. The two main ones to report are in FTSE and MidCap futures. The compressions are shown as blue bars, overlaid on the price range, as usual:
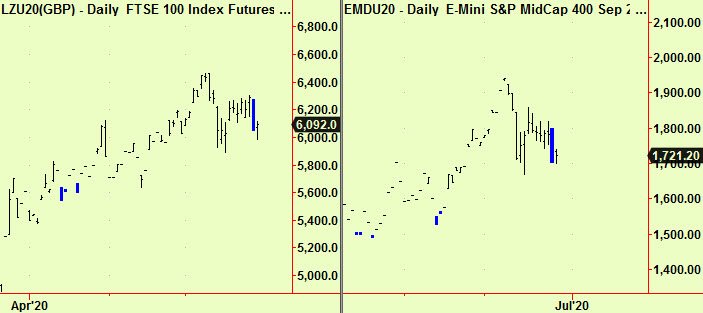
These charts look a bit scrappy as both futures contracts have only recently become ‘front month’, so they don’t have much history. The signals are still good though and they have the usual meaning – prices are about to start moving again, probably in the direction of the first break. Take care here though, as prices must be outside the area of the compression at the day’s close, for that to constitute a ‘break’. The FTSE has already dropped through the lows of the compressed bar but it has since recovered – this (as always with compressions) could go either way.
The longer-term outlook remains the same – for a trading range. We started to say this some months ago when the markets first started to fall away from the highs set in February. Although we still have the same overall view the ‘easy’ part of the range is probably now over. We were able to adopt a bearish view from just before those February highs and to identify a buying opportunity in late March and to warn of danger in our last newsletter on June 8th, after which S&P prices dropped 9% in 4 days. The price action is likely to become more erratic from now on and volatility may climb again – this is a normal consequence of a compressed condition.
We will try to catch the moves within the range, as usual, but the standing advice will be to take profits when you have them as any price is likely to be re-visited repeatedly.
Government bond markets have also re-compressed but seem already to be moving higher. Two examples from the US and UK:
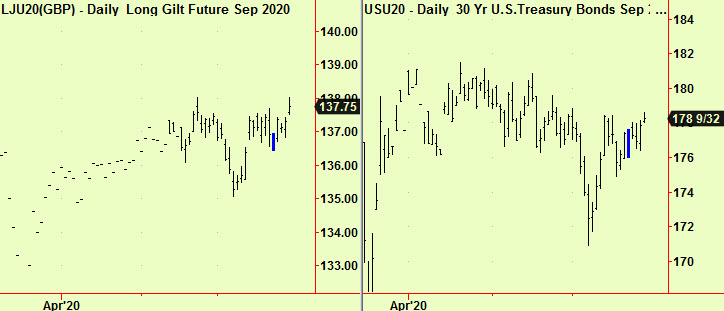
This is no doubt due to the latest piece of central bank jiggery-pokery, that of yield curve control. It goes without saying that trying to sell government bonds short when governments themselves are buying unlimited amounts of them is a stupid idea, so our comment about there ‘may be a rally to sell’ (in bonds) in the last edition is now withdrawn. There was indeed a rally, but we don’t want to sell it. Buy small dips for now, but don’t get long-term bullish.
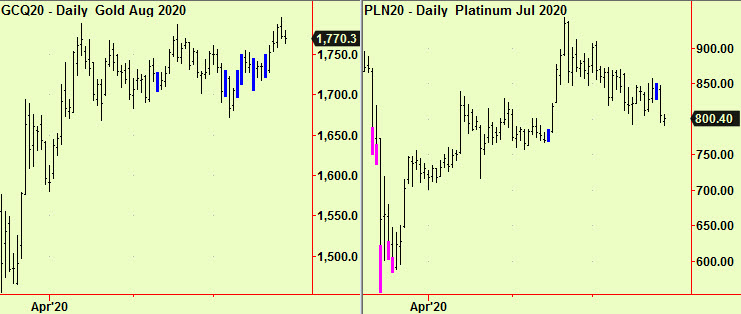
Lastly, precious metals have been compressing too. Gold has been range-trading for almost three months and started to compress earlier this month (see first chart below). It broke upward a few days ago and this is usually a sign that a new uptrend has started, That may still be be the case, as a temporary return to the compressed area is normal after a compression break but its close cousin platinum has done the opposite by compressing and moving down (second chart below). These two are unlikely to move in opposite directions for any length of time beyond a few days, so we must wait to see how this plays out. For now, expect some support in Gold at the 1750 level, only $20 below here:
All signals courtesy of software supplied by our friends at Parallax Financial Research www.pfr.com


