
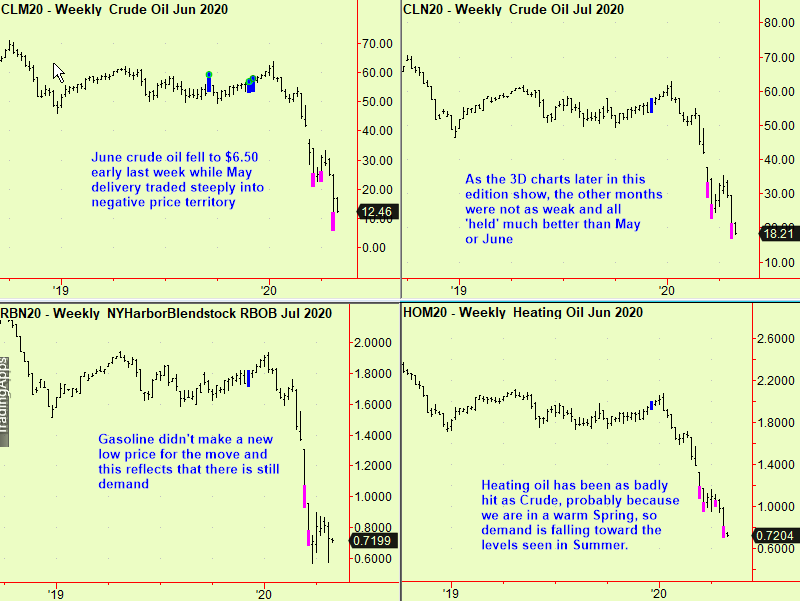
Last week’s astonishing events in which nearby WTI crude futures traded deep into negative price territory two days before expiry had all the hallmarks of a ‘selling climax’. We have waited until the end of the week to write about it as we wanted to see if there were any weekly-scale signals. Indeed there were:
It may be more helpful to show this in 3-D. Here is a chart of the seven crude oil delivery months from June 2020 until December, showing the price ‘ribbon’ from the end of February until today. You can see that prices at the far end (Marked Feb 28th) were about level, with each month trading at almost the same price as its neighbours. As time passed, the prices all dropped but those prices nearest the long wall fall most. Those are for nearest delivery: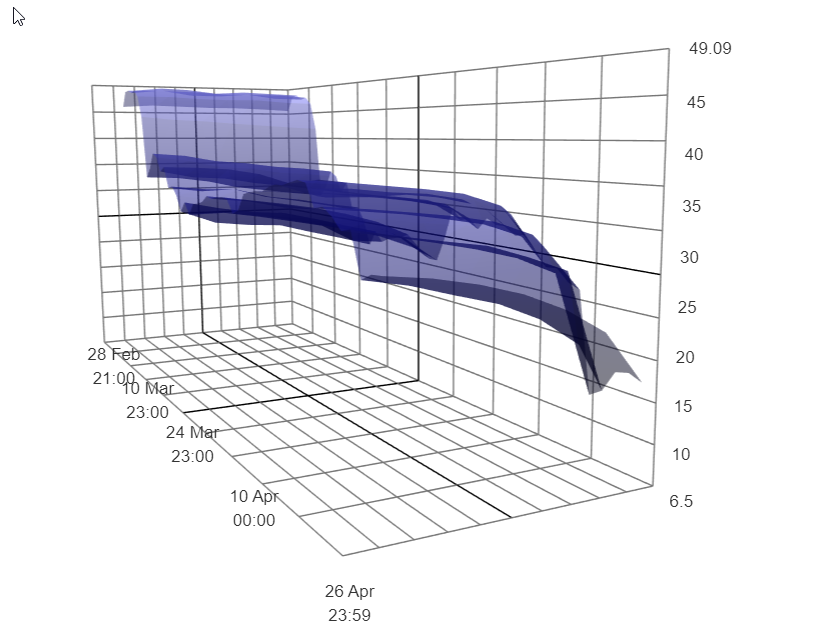
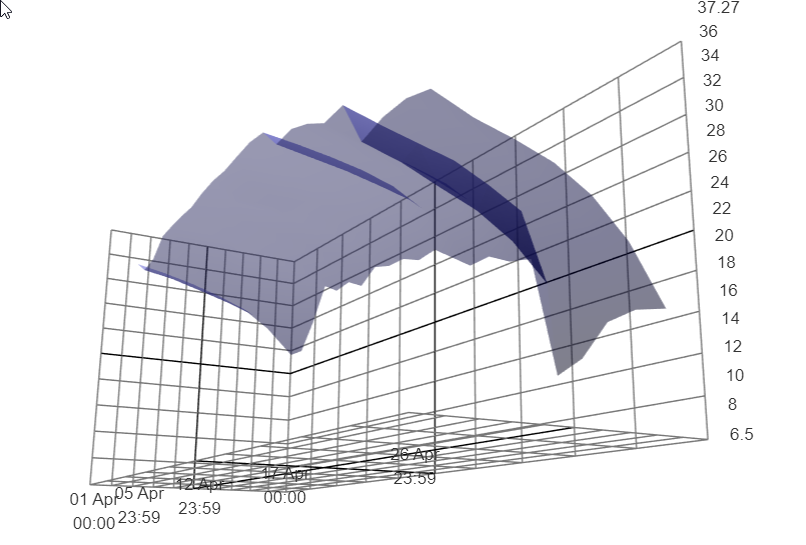
It seems even more obvious with only four weeks of prices displayed. Here the slope across the price ribbon was already pointing quite markedly downward at the rear (April 1st prices) but that slope is now extreme.
These ribbons do not include prices for May delivery, which expired mid-way through last week but the steepness of the slope reached an extreme then, from which it has since flattened a bit. This is an extreme version of a normal situation known as ‘Contango’ in which the nearer delivery months of a commodity are cheaper than those more distant. In normal times this indicates that the commodity is in adequate or generous supply and the premium for later delivery reflects the cost of storage, insurance and interest on financing required to own and keep it. These charges are collectively known as ‘the carry’ and usually represent a limit on the amount by which prices can differ from the nearby to the more distant deliveries. Not any more.
Now, there is a crucial shortage of storage for crude oil as the crazed production battle between Saudi Arabia and Russia pours product into a market where Covid 19 has simply imploded demand. As a result, the nearest deliveries of crude oil become a liability and the prospect is for oil gushing from pipelines and tankers with nowhere to put it. Obviously this situation cannot last and a sharp decrease in production is already happening. So, the normal operation of economic incentives and penalties resumes and we can expect that prices will eventually recover to some level where it will pay drillers to drill and refiners to refine again.
These weekly-scale bottom extension signals, shown at the top, together with the extreme price gradient shown in these 3D charts means that we are almost certainly at or very near the end of the lurch downward. The situation remains critical however, so it is probably wise to resist the urge to buy futures (yet). It may be worth exploring the long side of some oil producing and refining companies though, as these prices will eventually seem ridiculously cheap.
Elsewhere, stocks continue buoyant. US index futures moved higher from the recent compressions we reported in the last edition, meaning that we still recommend holding the long positions we advised in the March 19th edition, with stop-loss protection just blow these compressions. An update:
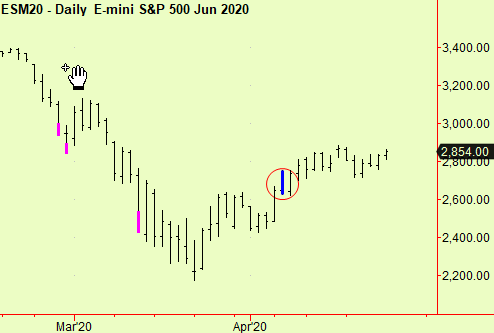
It is wort repeating here that we are not advising holding on to long positions in expectation of a resumption of the bull market. On the contrary, we still expect a trading range to form and that there will be opportunities on both sides of the market. Don’t overstay your welcome on these long positions – you may want to tighten stops even more as the market churns sideways at this dangerous level, having risen almost exactly half-way back up the drop.
All signals courtesy of software supplied by our friends at Parallax Financial Research www.pfr.com


