
The Reuters equal weight commodity index that we follow as one indicator has produced good signals in the past few years. Readings from this and a few other similar measures led us three years ago to say that commodities ‘as a whole’ would be ‘bumping along the bottom’ for some years, as prices re-based for the next commodity bull market. This has been the habit in commodity markets for many decades – a fit of enthusiasm that takes many (if not always all) prices upwards in a spike that lasts a year or two then a decline all the way back to where the spike began. Some years of quiet activity then follow as prices achieve some kind of supply/demand balance before the whole thing starts again.
There is often no ‘real’ reason for this and many of the commodities that join in the rally are never actually in short supply although there is a general view during the spike that a shortage is imminent.
There were two spikes in quick succession within the last dozen years – one that peaked in Summer 2008 and another that peaked in Spring 2011. The bigger the spike the longer the period of ‘bumping along the bottom’ before the next one starts and eight years is about the right amount of time for the next one to develop. This is what we have been watching for and these three charts tell the story:
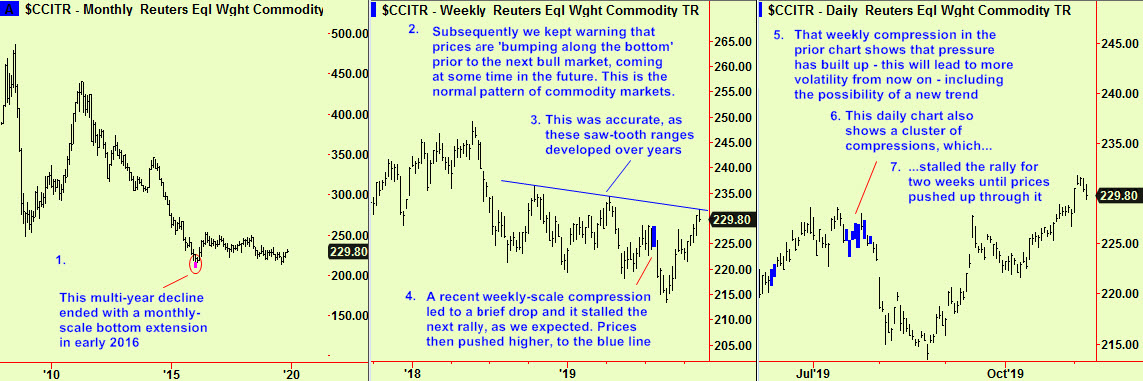
The middle chart shows a weekly-scale compression that happened in the summer. It initially broke downward and then acted as resistance to the subsequent bounce, as is normal. Prices soon pushed up through that resistance and are now sitting at a trend-line that has held prices down twice before (the blue line in the middle chart). This may stall the move, but if it is overcome that would be a bullish sign.
We still can’t say that a ‘new’ bull market has started, but conditions are right. We will continue to look for signals in individual commodity markets that will provide buying opportunities and the potential for upside movement could be considerable – just look at the first chart to see how small these recent gyrations have been compared to those of prior years….
All signals courtesy of software supplied by our friends at Parallax Financial Research www.pfr.com


