
There have been a series of compressions at daily, weekly and even one at a monthly scale in US stock indices:
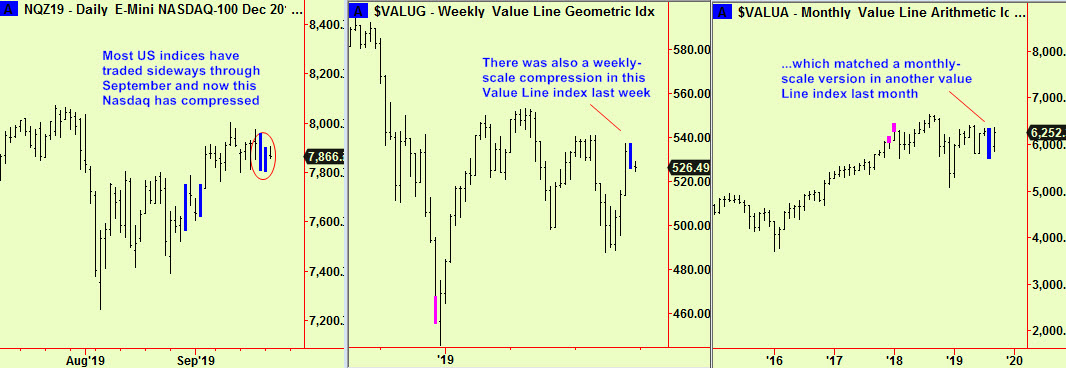
This has the usual meaning – the range has gone on long enough that pressure is building for a new move. We have asserted that US stocks are and would continue to be in a trading range since the beginning of last year – one reason being the two monthly-scale top extensions shown in the third chart above. That meant the imminent end of the uptrend and that a range was highly likely to form. It did and now we are contemplating the end of it, almost two years later.
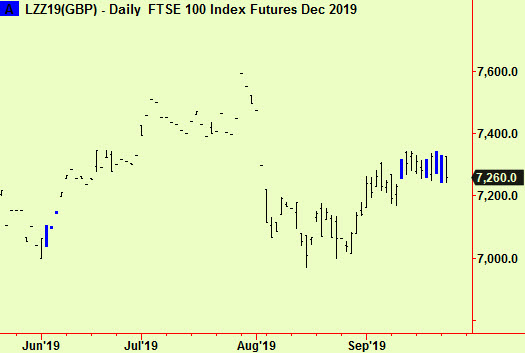
There has been a daily scale compression in the FTSE, where the special circumstances of Brexit have also kept it stuck in a range. This which will probably break soon, but we cannot say which way, as usual when markets are compressed:
We would remain short of any equity indices sold on the advice in our last edition. That advice was for short-term traders and we recommended putting quite close protective stops which have not been hit, so far. Obviously, if these compressions break downward then we will advise staying short for the medium-term, meaning that existing shorts will have a good ‘head start’. We will wait to see which way the break goes, as we generally cannot predict which direction the market will take after a compression
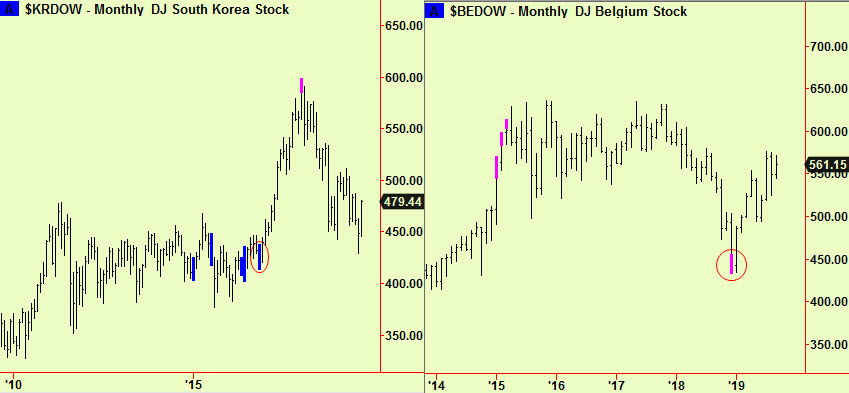
Two further long-term charts are interesting however and seem to mean that there is more eventual upside potential in equities than there is risk of renewed weakness. The first is of the Korean market, showing that it broke up from compressions after a trading range that lasted 5 years (!). The last compression (ringed) then acted as support in the normal way and the market has since bounced. It will most likely continue upward and we would buy any small dip. The second is our old favourite, Belgium. This was the only index anywhere in the world that produced a monthly-scale bottom extension (ringed) in the end-2018 drop.
There were others that made weekly-scale signals (see the December 26th edition) that made us issue a buy recommendation then but they have elapsed. This monthly signal still has some life left in it, which means that there is some upside bias from hereabouts. We have often pointed out that less-examined markets can produce signals that have more general effect, so the question is – do these two have any strong connection with the rest of the world?
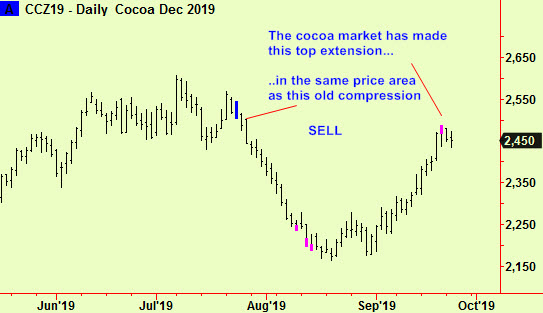
Lastly, Cocoa has made a top extension at a daily-scale after a good runup from a low point in August. There were some bottom extensions near the end of the prior drop, but the more interesting signal is the compression, from which prices fell in late July. This new top extension has occurred very near the level of that old compression, where we expect resistance in the usual way. The combination of these two signals is strong enough to warrant an immediate short sale:
All signals courtesy of software supplied by our friends at Parallax Financial Research www.pfr.com


