
US Bonds continue to be pushed in several directions. We have written here before that tax cuts in anticipation of increased economic growth increases the need for issuance of Treasuries, during the wait for increased tax receipts to flow. This is the main bear case for 10-year notes and 30-year bonds while inflation remains low and the FED is seemingly paused in the task of increasing interest rates back toward ‘normal’. Debate continues as to what ‘normal’ might be as it has done in every regime that this author can remember. The unknown in government bond markets is always the demand side of the equation which is why it is always a bit easier to be bearish – the arguments are always simpler.
Currently the ‘flight to quality’ that is one of the main reasons to be a bull of US debt has few enthusiasts. Stocks have rallied, economic growth is firm (if not yet firm enough to yield those higher taxes to pay for the cuts) and there is little sign of a credit crunch that would make commercial debtors unable to repay their bonds. This last item is much written about, as if the sheer volume of debt that is building up is the same thing as a crunch. Debt build-up is a situation, whereas a crunch is an event. One precedes the other but the mere existence of lots more debt does not tell us when a crunch will arrive. For now, the bull case is pending, not current so we are inclined to look at the markets a little bearishly. The main reason is not this brief economic analysis, which is not our forte but the weekly-scale top extension that we saw in the 10-year future in January:
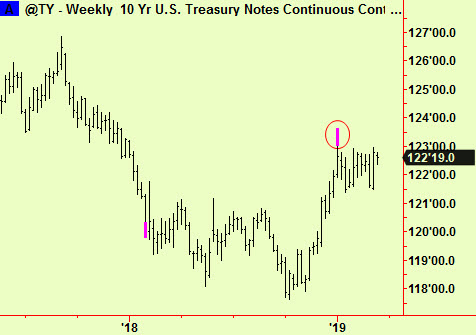
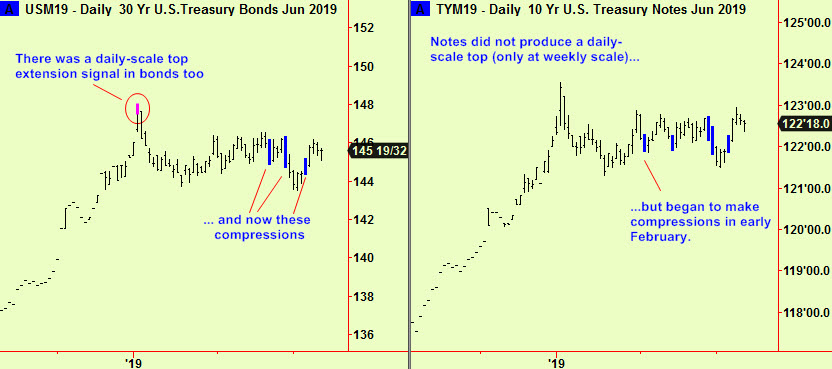
This signal occurred ten periods in the past, so it is still ‘in date’. It is worth mentioning that the median shelf life of these signals is 17 periods but there is considerable variation around that figure. When a signal has proved to be so precise (as this one has) the shelf life tends to be longer. The US Treasury note and bond markets dropped a bit after this signal and have since range-traded. More recently, some daily-scale compressions have formed, as usual in such a long-standing range and yet there is still downside risk. As prices have recently rallied, it is worth trying a short here:
This is not just advice to ‘trade the range’ – which would be entirely sensible – but also to point out that there is some chance of that range eventually breaking to the downside.
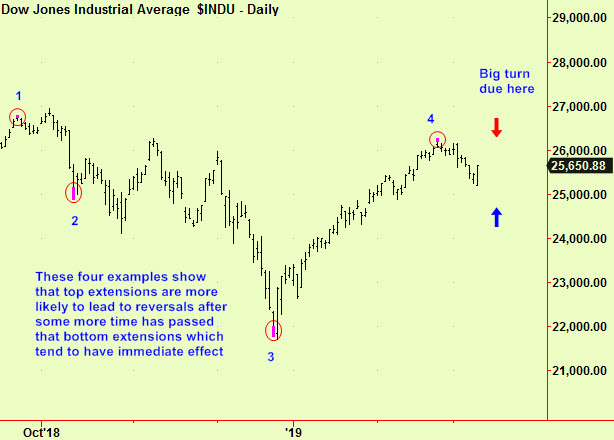
Stocks have rallied after dropping from an S&P high on the 4th March. There were a series of top extensions in various US equity indices that we reported, most recently in the Dow on the 25th February (see 26th edition) which was the high point in that index. That signal is now 11 periods old, so is also still ‘in date’ but we are always inclined to be cautious with top extension signals, as we often remind our readers. A top extension marks the imminent end of an uptrend but need not lead directly to a downtrend – there may need to be some kind of ‘top’ formation first, which means some churning back-and-forth. We think that is what is now happening here. The speed and force of the rally yesterday had all the hallmarks of a short-covering squeeze and open interest did decline by an unusual amount (masked by the rollover from March to June futures) which tends to confirm that view. We are not joining the ranks of the ultra-bears but think that there will be more weakness to come, within the range that started in January 2018.
There may be some help from our analysis of turns. There is nothing important on the ordinary turn schedule, as a glance at our front page reveals – there are no big turns due this month at all, just routine events clustered at weekends as usual. There is however one big turn from a different series (that we watch but don’t publish) due on Monday March 18th or the subsequent two days and it seems probable that this will coincide with an important high point. As ever when using turns, the prior trend is all important, so if prices are currently rising into that date it will almost certainly mark a high. If prices are already falling it will probably be a low:
All signals courtesy of software supplied by our friends at Parallax Financial Research www.pfr.com


