
The equity rally since the low point the day after Christmas (Boxing Day here in the UK) has been brisk and has brought the S&P up by over 11% from that low to today’s high. Whether you think this is a bear market bounce or the start of a bigger move up, it is always worth remembering that no market goes in a straight line for ever and there will be resistance to further price rises somewhere up ahead.
The prior down move from the first week of December started with the break of weekly compressions in several US indices and these will now offer the most likely resistance. As I write, the lows of these compressed areas are about 2% above today’s highs of 2581 in the March S&P futures and 23864 in the cash Dow. Here are updates of both those charts showing the compressions ringed in red. Don’t chase strength into these areas.
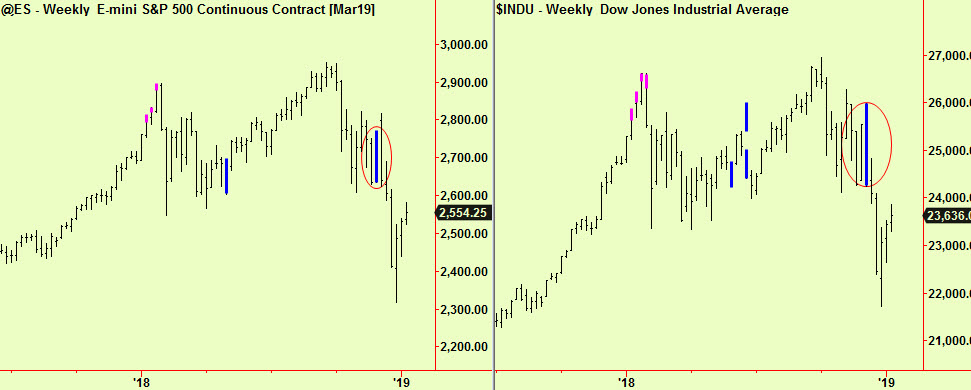
It is also worth pointing out that these are quite roughly-defined areas of resistance which are actually acting as ‘attractors’ for the price, as is normal in the case of compressions (see our userguides). They are also quite wide – in the case of the Dow the span of the compressed area is from 25980 to 24240, or 1740 points.
That means that you should not automatically sell just because these levels are near but wait instead to see how far the market may get before deciding to take some profits and maybe try a short. It is also possible that these markets will only approach these compressed areas (i.e not quite reach them) before falling away. A partial penetration of the compressed area is more normal but we have seen examples of both in the past.
This is no time to relax.
All signals courtesy of software supplied by our friends at Parallax Financial Research www.pfr.com


