
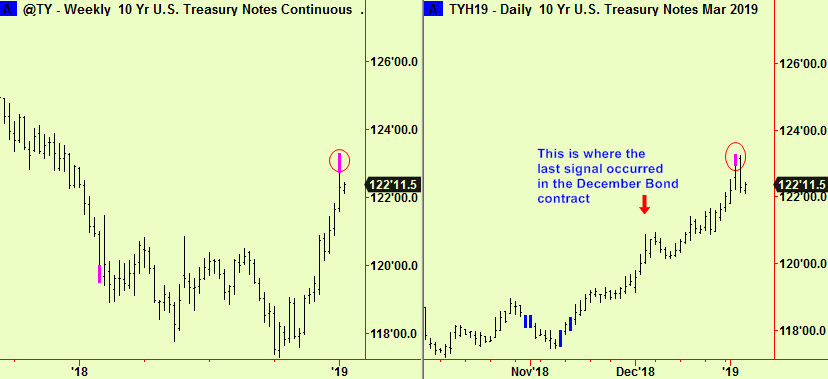
There was a weekly-scale top extension in the 10-year US Treasury note future last week and a daily-scale version on Thursday. This is the second extension the current up-move has developed, the first one was reported in the December 5th edition. That led to a point and a half dip in bond futures after which a new high was made nine days later.
Now we have signals at both a daily and weekly scale, so we are inclined to try selling the longer end of the US Treasury curve short again. It is worth repeating the comment that we made in the November 28th edition pointing out: “….the (coming) weight of new bond issuance to ‘plug the gap’ between decreased tax revenues now and increased tax revenues from increased growth (if that happens) later (from the Trump tax cuts). This will press down on bond prices…”
This fundamental outlook hasn’t changed, which is another reason why we are trying to sell short longer-dated US treasuries from time-to-time when we get an appropriate signal, as now. As ever with top extension signals, it may be better to wait a bit to see if some kind of ‘top’ develops that then leads to weakness a little later. In this particular case however the coincidence of weekly and daily scale signals makes a stronger case for selling sooner rather than later.
All signals courtesy of software supplied by our friends at Parallax Financial Research www.pfr.com


