
Stock have dropped since our December 13th edition in which we pointed out some nearby overhead resistance in the European markets. The first chart below shows an update on one of those markets (Switzerland) with that resistance from a recent compression ringed in red. The arrow shows the date of that edition. The second chart is an update of one we included in the December 6th edition and points out a fresh weekly-scale compression signal that had developed in an S&P500 futures contract. Prices have now fallen through that compressed area, which is a warning that more weakness is possible.

Despite this warning we have not yet become long-term bears as we have thought for some time that the trading range that has restrained US equity indices all year might simply widen, as ranges often do. An example of this can be seen in the second chart above, when the S&P made a slight new high for the year (it was in September) but the fell back into the same range as before. The same thing could now happen at the range lows.
Although we have yet to see any bottom extensions in the major indices, we are seeing some in a few US sectors such as Transport and Oil and Gas – some even at a weekly scale as shown in these next charts:
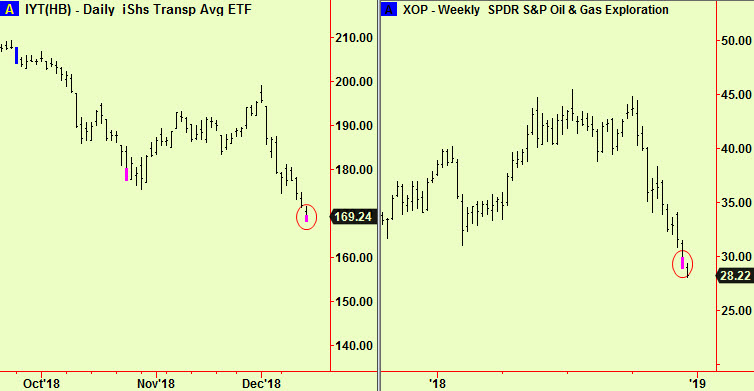
Extensions signify that a great deal of consensus has formed among players so this indicates that the down-move has produced a surge of bearish sentiment. This can also be easily detected simply by reading the press. Prices can fall in the face of a great deal of bearishness but it usually means that they can’t fall yet. Be extra vigilant here and if you sold any equity markets on our advice in that December 13th edition then don’t overstay your welcome. Prices could easily hold hereabouts and stage a rally. Place quite tight protective stops on shorts, or just cover. We will advise if we get a decent ‘buy’ signal.
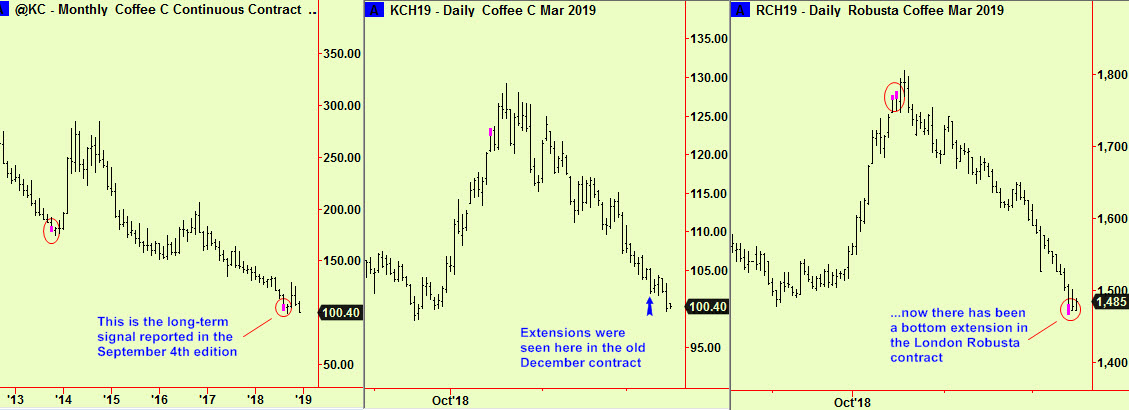
Elsewhere, we reported that the expiring December Coffee ‘C’ contract was making bottom extensions in its dying few days. Prices have fallen about 25% since the rally highs of October and are now near the multi-year lows seen in September. There were long-term signals that showed this decline would end, as reported in the September 4th edition and we think that this dip is a second chance to adopt long positions. There is fresh evidence for this view from the London contract for Robusta coffee, as shown in the last chart in the series below.
Lastly, we reported some compressions in the US$ in the December 14th edition. There was no break of the $/€ compression (despite evidence from some early trading), and the $/¥ broke downward, as shown in these two updates:
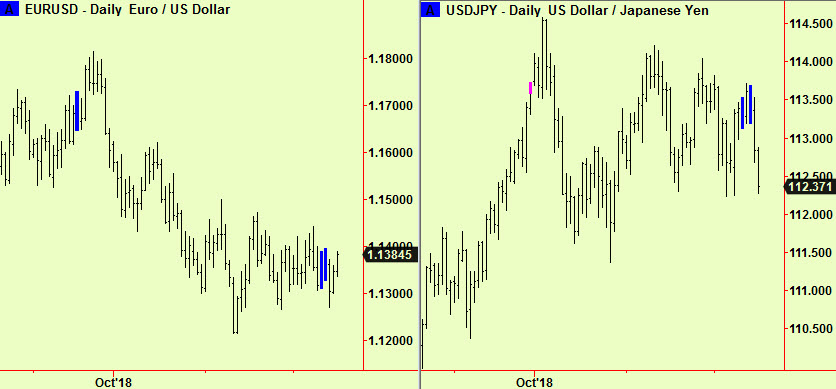
This is a timely reminder that a compression is only broken when the market price closes outside it. Merely pushing through on an intra-period basis will not do.
Although the $/¥ has broken in the direction of a weaker $, the price has already moved quickly to the recent lows and so we do not advise any trade here – these pairs are both still range-bound and we will continue to watch closely.
All signals courtesy of software supplied by our friends at Parallax Financial Research www.pfr.com


