
The trading range continues in US equities, as we suggested would happen at the beginning of the year. The likelihood is that it will persist for yet longer and here we attempt to define its limits. Markets can be erratic and still remain ‘range-bound’ so we do not assume that the limits of this range will continue to be defined by the year’s high and low points. Our regular reports will try identify the highs and lows as they occur but in this edition we are looking at the bigger picture.
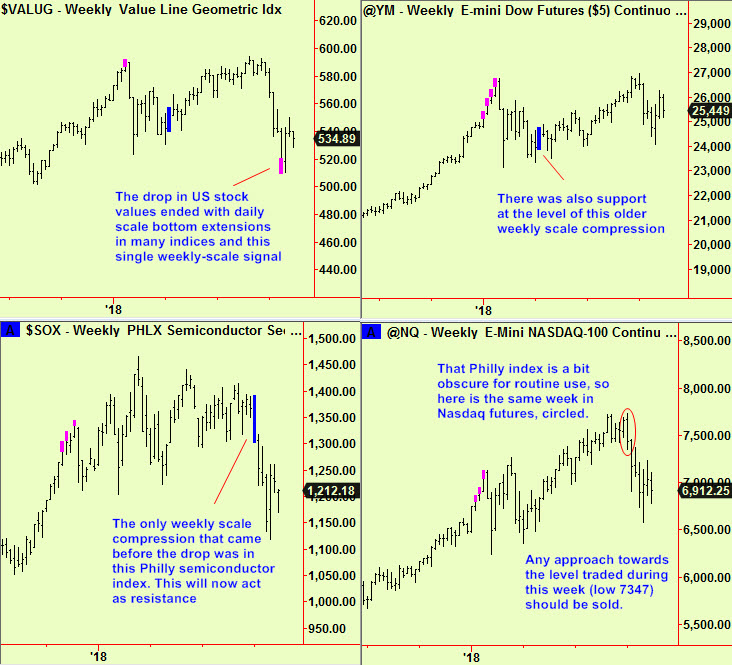
There were many top extension signals at or near the market high point, as reported in multiple editions in late September and early October, so we do not show them here. We are now more concerned with support, as there is much bearishness in the market place and so some perceived danger that prices will simply fall into a bear market. We think that risk is small (for now) as the support shown in the top two charts in the next series illustrates. There has been a weekly-scale bottom extension in the Value line at the same level as clear horizontal support in the Dow. This combination will be hard to overcome and so we think the market will ‘hold’ on dips even if slight new yearly lows are made.
There is obviously going to be resistance above the market at the recent highs (similar to the highs made in January in many indices) but we think that there is also resistance at or near the level of the weekly scale compression that occurred in the Philly semiconductor index, which is a good bellwether for the Nasdaq. We also show the equivalent levels in the Nasdaq, even though there was no signal in that index – it’s simply easier to follow.
Meanwhile, energy markets (except natural gas) have fallen consistently, while generating bottom extension signals since earl in the month. In our November 2nd edition we pointed out the first of these, together with some horizontal support from an older compression in Heating oil. Prices continued to fall and even traded below the lows of that compressed area. This does not mean that we have now become bearish however as there has now been a bottom extension in Brent crude futures too – perhaps the most important member of the energy group. An update to the heating oil chart and that new Brent signal:
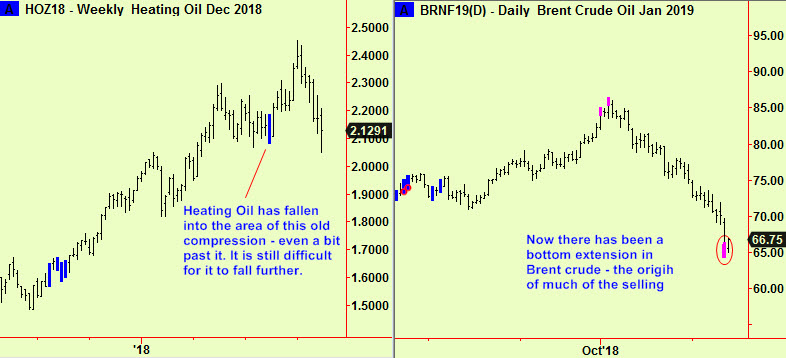
This has been quite a painful drop as we became bullish too early. As the note in the Heating oil chart points out, the area of older compressions continues to supply support even if it is temporarily punctured. This is (thankfully) rare but means that we should expect energy prices to stop falling around now and that they may then stage a good rally. We will advise further as events unfold.
All signals courtesy of software supplied by our friends at Parallax Financial Research www.pfr.com


