
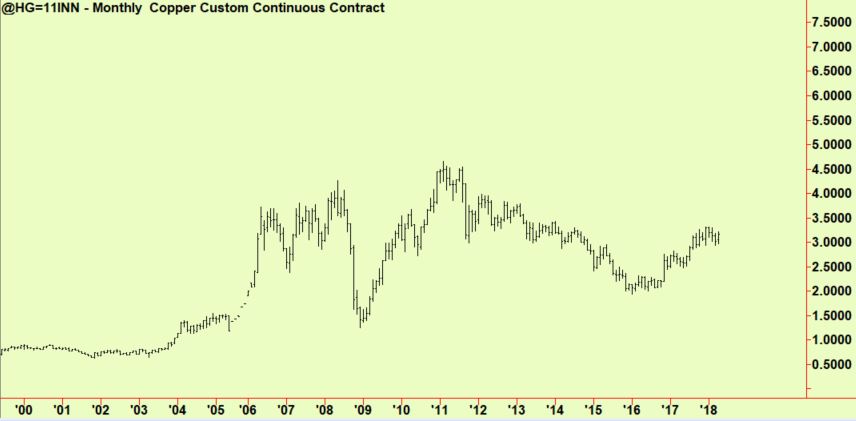
It is useful to compare the fortunes of the main traded grains in the past decade or so as China has risen as a major consumer, with that of copper. This is a good benchmark for other industrial commodities and a monthly-scale chart shows that it is now trading in a range that is roughly bounded by $2 a pound and $4 a pound. Before China and the other emerging economies started to use more of it the usual range was well below $1. Our suspicion is that prices will trade back toward the low end of the current range as more supply arrives in the market, but in no circumstances can we imagine prices falling back to the levels at the start of this chart*.
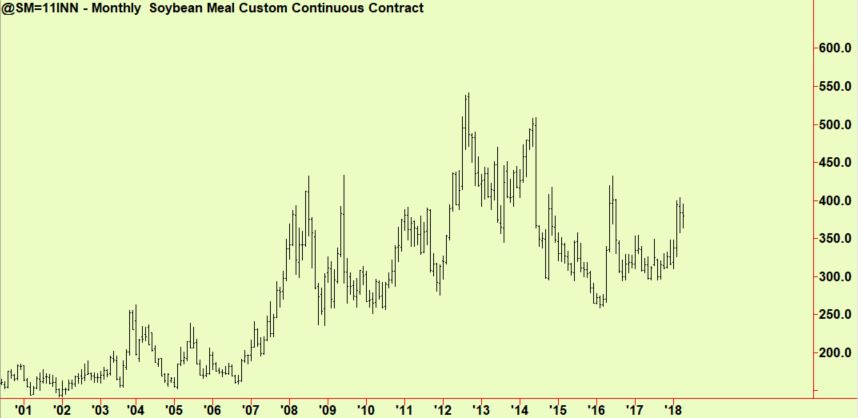
Soya has gained in importance as dietary habits shift in the newly-affluent parts of the world. People now eat more meat which means much more demand for animal feed grain. Much of this feed is Soya meal and prices reflect this. The price now ranges between just under $3 and around $5, compare with less than $2 when China was still poor:
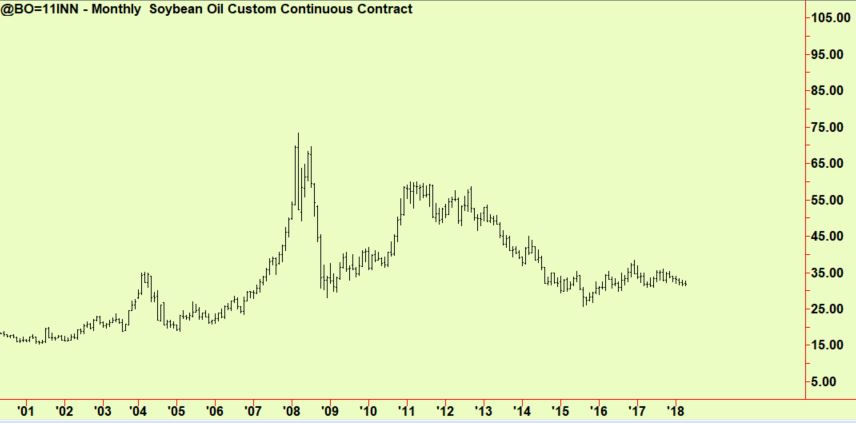
We sometimes write that Soya oil – the other product of crushing Soya beans – has become something of a ‘poor relation’ as the demand for it has not grown as much as for meal. This is reflected in the longer-term price history in which the prevailing current levels are only a little above those of a dozen years ago:
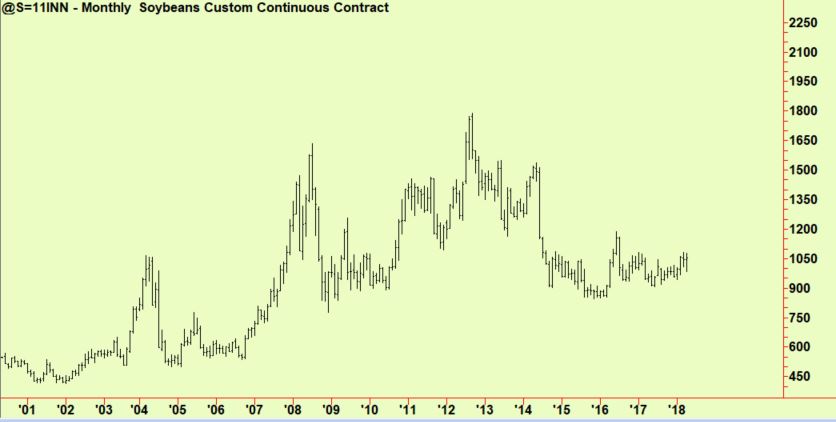
The source for both of these products are raw Soyabeans, whose price is now routinely above $10 which was an aspiration for earlier generations of farmers. ‘Beans in the teens’ was the cry if prices ever rose towards $10, but they always fell back down to $5 or $6 until this century was well under way:
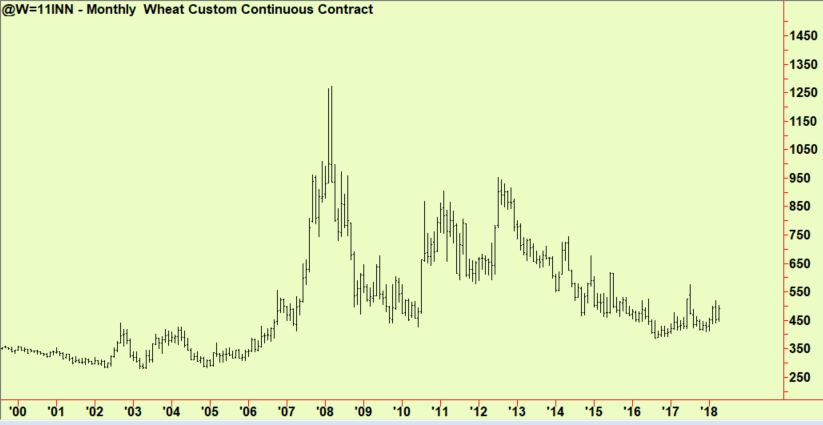
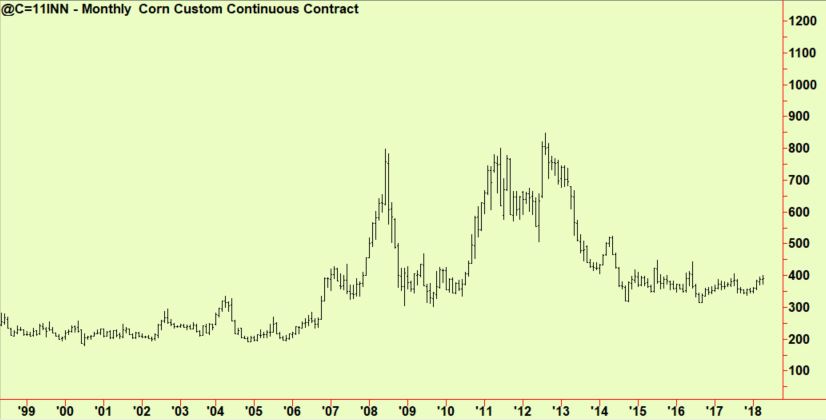
Other grains have not risen as much. Corn and Wheat are both in greater demand than before, if only because world population growth is steady at 1% per year or so, but yields have also increased so total production is rising at a similar rate. Due to this precarious balance, prices have not held their major gains and (although slightly higher than in the past) would still be recognizable to 20th Century farmers.
*All these monthly charts are ‘unadjusted’ for futures expiry, so they reflect the price at the actual moment shown.
Back now to the present. In recent weeks, there have been two weekly-scale top extensions, as reported at the time, in Wheat and Soya meal. These both came at the exact end of the normal February rally that had brought prices up quite well in Meal, less so in Wheat and hardly at all in Corn. The Corn rally stalled at some old compressions, which can be considered the normal ‘return movement’ that we see all the time when a compression is broken. This is part of the usual dynamics of any non-linear system (such as an auction market) and such points are referred to as ‘attractors’ in the mathematics of the field. In market terms, the price re-visits the same area before moving away from it again. Knowing this helps enormously when trading.

This means that each of these can be sold with varying degrees of confidence. We always like to choose the weakest member of the group to attack, much as wolves behave when selecting their lunch. That means picking either Wheat or Corn but the Meal signal is also impressive, so we would be happy choosing that too.
All signals courtesy of software supplied by our friends at Parallax Financial Research www.pfr.com


