Sugar and Copper markets have both made daily-scale compressions lately. Copper compressed, broke downward and briefly rallied to re-visit the compressed area. Sugar has just compressed and (apparently) broken down today – we have to wait until nearer the close to be sure.
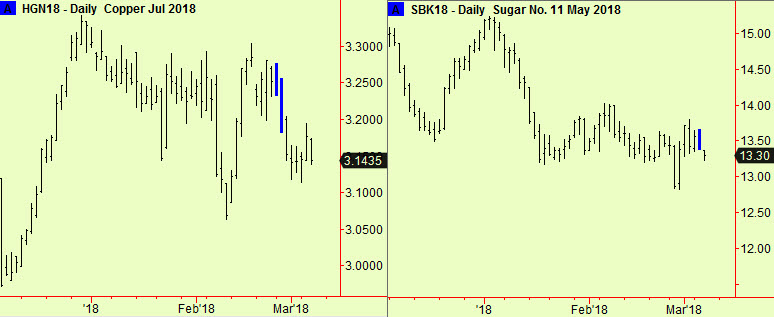
This copper market behaviour is typical of a compressed market that is starting a downward move. The initial break is usually followed by a rally back to the compressed area before weakness resumes and the ‘main move’ begins. Such ‘return movements’ are not inevitable, so we allow readers to choose whether to sell the initial break downward or to wait until the market tries to regain the compressed area before selling. In the case of copper, that rally has definitely occurred, so sell now.
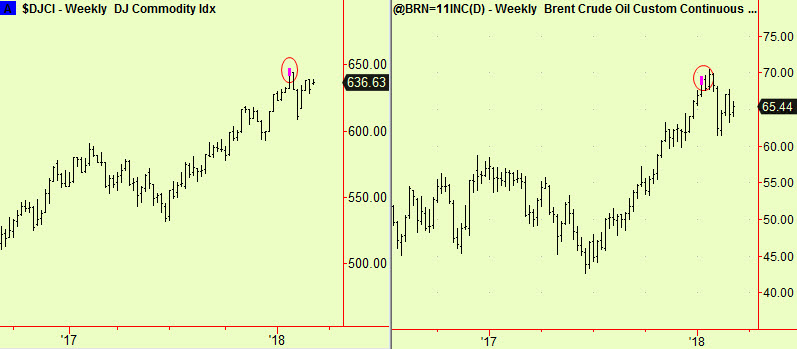
There are some longer-term reasons to think that a commodity down-move might last through the Spring as the next two charts show. There was a weekly-scale top extension in one of the commodity indices that we follow in late January and a slightly earlier weekly signal in Brent crude – this is no surprise as this index is weighted in favour of energy components. These signals have a shelf life of about 4 months, so the more recent example still has many weeks to go before it expires:
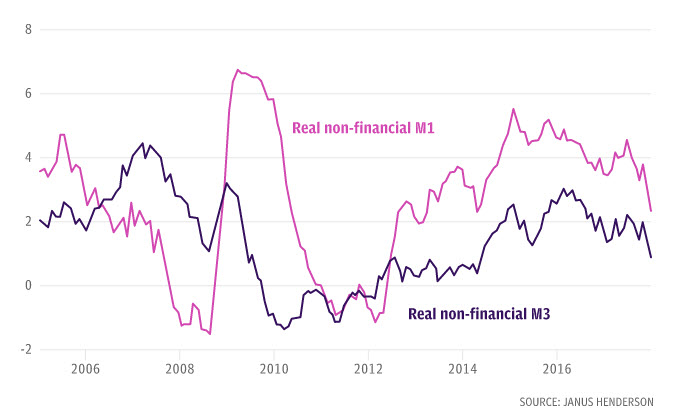
There is another reason to be pessimistic about commodities. The composite Eurozone money supply figures compiled and published by Simon Ward at Janus Henderson show a likely economic slowdown coming soon – this is at odds with the prevailing optimistic view of Europe’s prospects, which is largely based on extrapolating current conditions. This indicator has a good record of predicting future economic conditions, so is quite useful for commodities (but much less so for equities, as every seasoned investor knows):