
The American $ has been weak for over a year, within a broad range that has roughly held for three years. It has not been precisely well-defined, but it has nonetheless been a range:
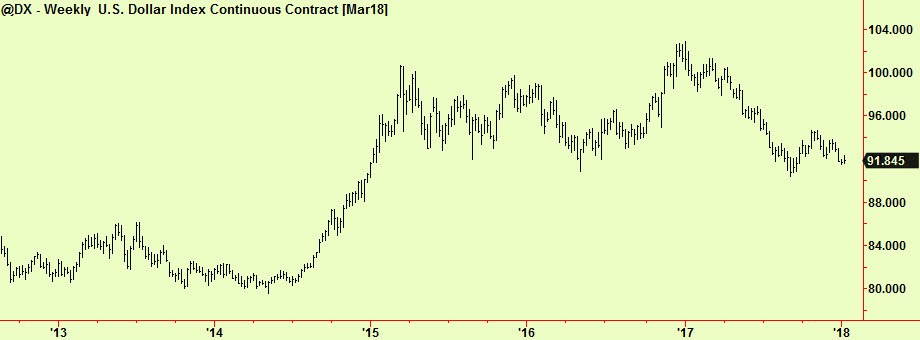
At the beginning of 2017, this index pushed briefly above the prior range but the present decline soon began and now we are near the bottom end again a year later. The beneficiaries of the US$’ss weakness have been various – there has been a kind of ‘rotation’ in which other currencies have taken turn to strengthen. The most recent few weeks saw the Euro as the ‘leader’ on the way up and there have been some signals that we update here:
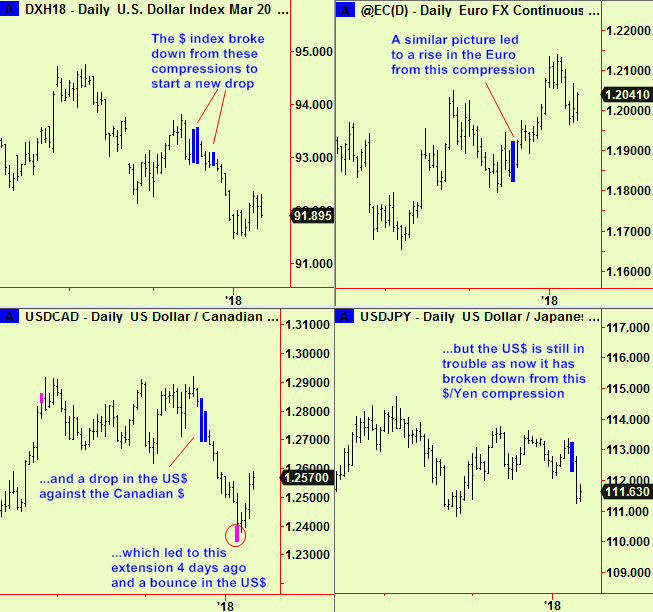
The last of these charts shows that the $/Yen has just broken down from a daily-scale compression and this probably indicates that the Yen will assume the lead as the $ falls further.
As a note of caution – we are aware of the dangers of getting too bearish at the bottom of a range. We consider the danger to be reduced because there is likely to be a ‘range extension’ here that will mean the index shown in the top chart will make a slightly lower low, just as it made a slightly higher high in early 2017. If this proves to be the case, $ values have aboit 4% further to fall from present levels, which would take the $ index down to around 87.50.
We are long Yen and will look to sell the US$ against the Canadian$ on an approach to 1.27, where we expect the old compression to reverse the current bounce so the downtrend can resume, as is usual after moves that start with compressions.
All signals courtesy of software supplied by our friends at Parallax Financial Research www.pfr.com


