
We reported top extensions in the S&P in the September 21st edition and now there have been several more in US indices – the S&P 400 midcap, small-cap Russell 2000, and the Value Line broad-based index:
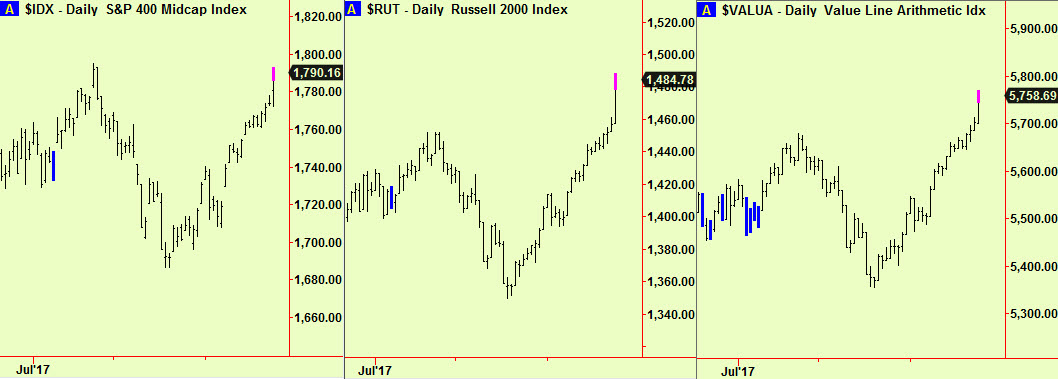
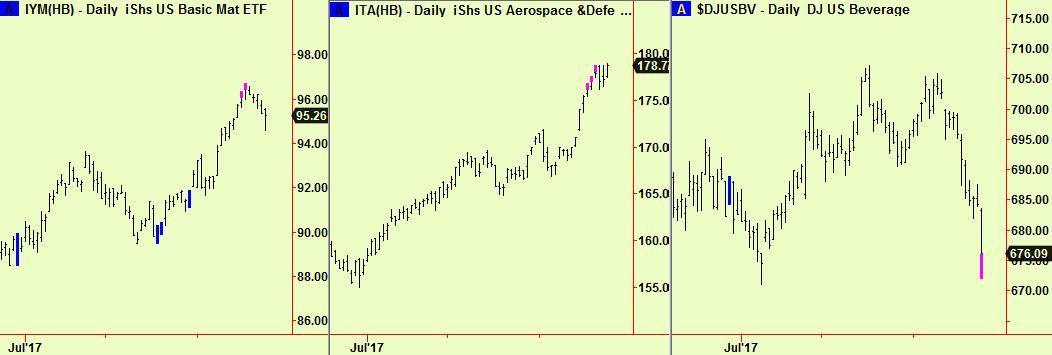
All these surged to new highs for the move yesterday, while the Dow and Nasdaq indices didn’t and the S&P only made a tiny fractional new high. This continues the divergent behaviour that we have remarked in recent editions and also reflects the sector rotations that have been happening lately. Some sectors have been making top extensions (defense, basic materials, energy, oil & gas) while a few others have been falling into bottom extensions, like the beverage sector:
This is a sign of some increased downside risk and is borne out by the longer-term picture. Here, various measures of the Dow made weekly-scale top extensions in early August which led to a small dip and then fractional new highs. We often point out that top extensions can lead to the start of a ‘topping’ process and this may have begun in the Dow. That possible ‘top’ may be further advanced in the Nasdaq, which made weekly-scale top signals in early summer, followed by prices ranging up and down:

Any weakness from hereabouts would lead technical analysts to start mumbling about ‘triple tops’ or ‘skewed head and shoulders’ or some other such charty jargon.
We would trade from the short side now, if you haven’t already begun to do so. Don’t bet the farm yet as the ‘balance of probability’ has shifted in favour of downside risk, that’s all.
All signals courtesy of software supplied by our friends at Parallax Financial Research www.pfr.com


