
Much has been written elsewhere about the tight trading ranges that have formed in stocks, bonds and currencies in the last few months. This is reflected in the signals that we have been getting – most of which have been compressions. Compressions form when markets are directionless or range-bound and signify that pressure is building for a move – either up or down. The result is often a new trend but it is also possible that the range may widen a bit before a new compression then forms. The behaviour of Korea in its five-year trading range is a good example of this:
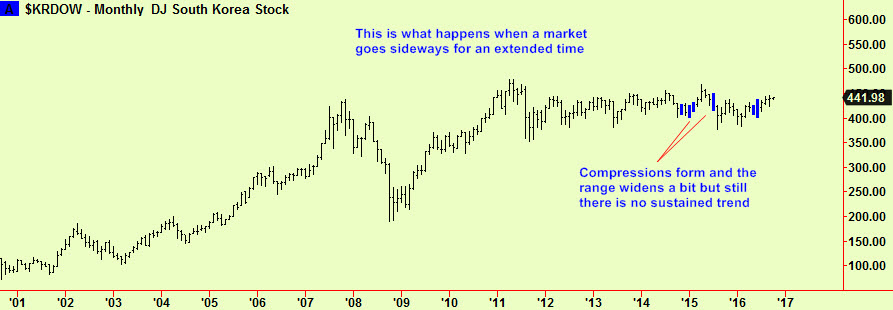
This is an extreme case but other equity markets have also made repeated compressions, as seen in the Indian index in the second of these next monthly charts – a move comes along eventually but patience may be needed together with great vigilance in case of false breaks and the danger of whipsaw.
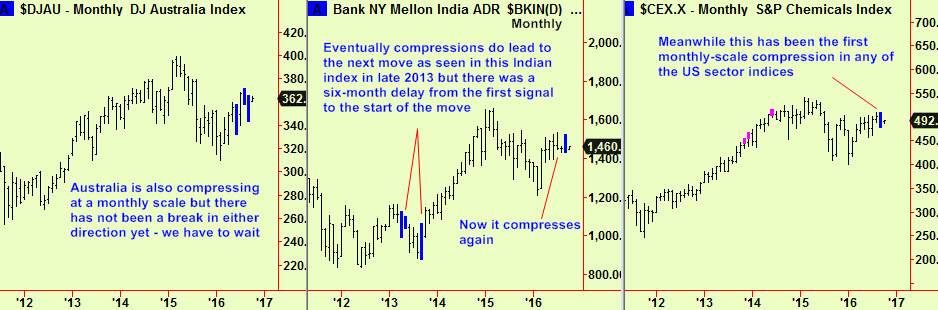
US equity indices have been gradually rising over the last few months but the pace has been so slow that we now see the first monthly-scale compression there for several years, albeit in a sector index (see last chart above).
There have been monthly compressions in Europe too as shown here in the first chart below. The Eurostoxx made that compression in July but it has not yet broken. There have been new weekly-scale compressions too, as shown in the second Eurostoxx chart below, meaning that there is still great disagreement between market participants and that pressure is building up for imminent change. This probably means a new trend is coming but it could also just mean that there will be a range expansion. We will look for other clues as events unfold.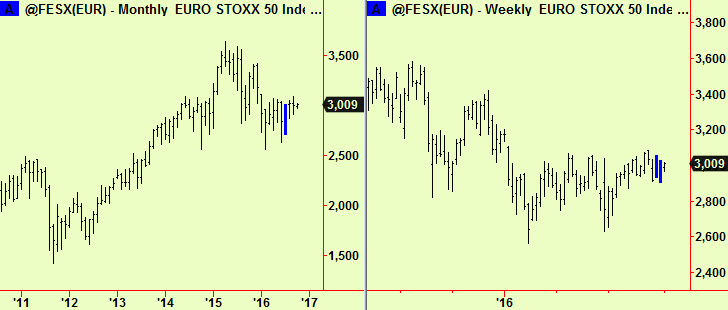
More recently there has been a spate of daily-scale equity market compressions in the US and Europe – too many to show here except for this sample, firstly of US indices:

We remain bullish of US equities, as we have been for some time but there has been little to encourage us in this view lately. In order to continue with this bullish view, these new daily-scale compressions would have to break upwards and if they do not we will place the view on hold.
The latest compressions in Europe and Japan:
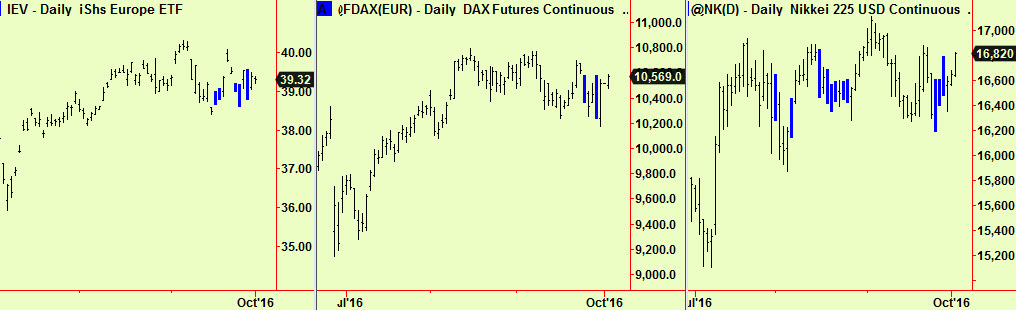 All these new daily-scale compressions mean that a break is coming very soon, out of this very narrow range and that break may be enough to push prices out of the weekly-scale compressions too. There is very great danger of whipsaw in the meantime, so be careful not to chase strength or weakness.
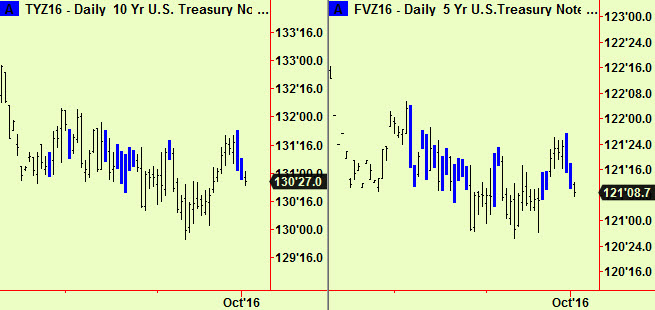
The picture in Bonds is a little different. Most government bond markets have been strong due to the persistent buying by central banks as part of ‘QE’ programs. Even where such programs have ended (as in the US) the large inventory of accumulated bonds has had the effect of keeping prices high. This has also squeezed US ten-year notes into the tightest trading range in a decade. Unsurprisingly, this has produced compressions in five- and ten-year note futures.
These appear to be breaking downward as I write but we are very cautious about selling bonds as the market has been ‘managed’ for a long time and this has destroyed the usual ebb and flow of buying and selling that our methods reveal. There will probably be an eventual drop in values that will be caught by just such a signal as this but traders may incur more losses along the way before the eventual ‘crack’ occurs. The term ‘widowmaker’ was borrowed from the military to describe the habit of trading bonds from the short side and there have been plenty of widows.
European bonds have also traded sideways and are also heavily compressed. The only movement has been in German Bunds which rallied a little out of compressions 2 weeks ago and are now heading back down toward those compressions. We do not show Bunds here but French OATs instead (last chart) which have behaved in the same manner as Bunds, whereas the British and Italian bond markets in the first two charts have been completely motionless, making new compressions as they go:

Commodities and currencies have also been compressing – more on that soon.


