
The recent small dip-and-rally in US equities has been bounded by compressions. The ‘senior’ analysis is of weekly signals as shown in the first of these charts. The weekly compressions in many US indices that formed in late June have twice provided support on the dips in the last six weeks. The more recent of these dips started with a daily-scale compression (second chart) that is now offering some resistance to the rally. The resistance seems less convincing as each step of the rally in the last few days has pushed a little higher and this may eventually overcome the whole thing so the market could then push even higher.
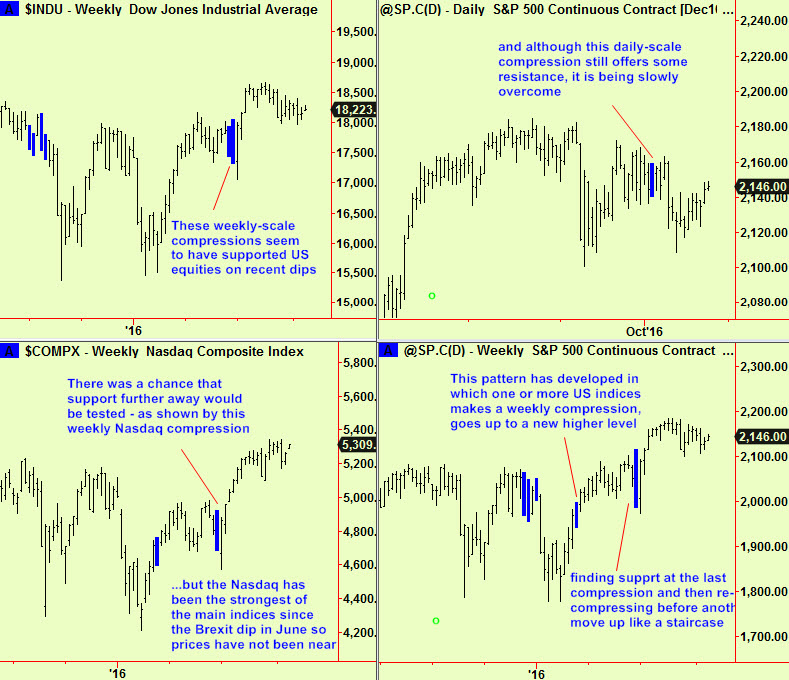
Still looking at the US charts above, there is support much further below the lows of the last six weeks as provided by the old Nasdaq weekly compression that also formed in late June. That is now a long way below current levels as the Nasdaq has been the main beneficiary of the rally since then. It seems we may be ‘stepping up’ in the US as shown in the last of these four charts. A compression forms, breaks higher by a small amount and the market then re-compresses before another small step up. This can accelerate of course, as may now be happening in the Nasdaq. Another possibility is that US markets will remain range-bound with one or two sectors drifting into fashion and out again, as has been happening for the last two years.
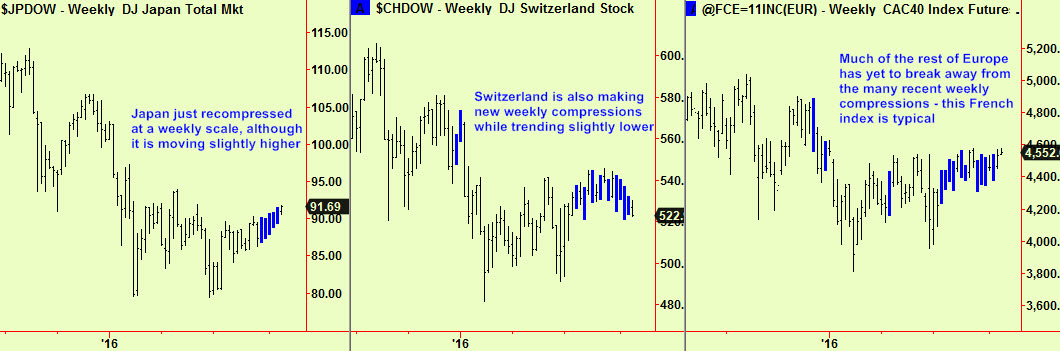
Japan and Europe are still compressed. Some new weekly compressions appeared in both places last week, although some of the main European indices are trading (just) above their compressed levels. It is too early in the week to tell if this constitutes a ‘break’ into a new uptrend but we are vigilant. Charts:
More soon.


