
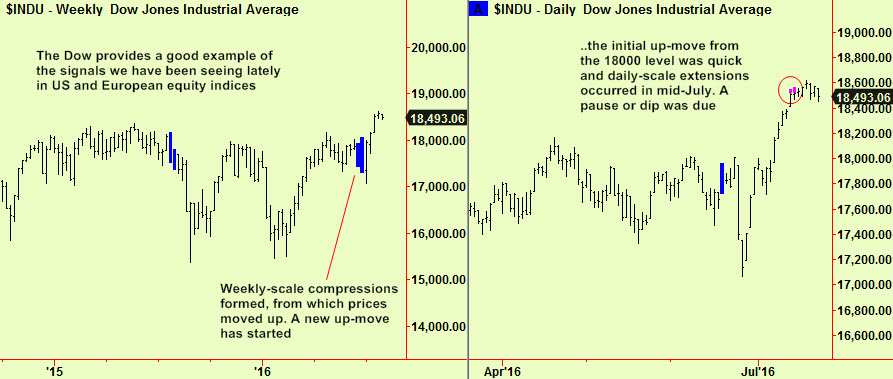
Equity markets have been trading mostly sideways since we reported top extensions in the July 15th edition. We often remind readers that top extensions mark the imminent end of up-moves but not necessarily the beginning of down-moves as there may need to be some kind of ‘top’ that forms before any weakness can start. In the present situation, there is the added complication that US and European equity markets have moved up from weekly-scale compressions, which argue that a longer-term uptrend has begun. This makes it highly likely that we are just seeing a pause in a bull market that we strongly suspect will accelerate and then generate a bubble*. We can sum up the situation in the US using the Dow:
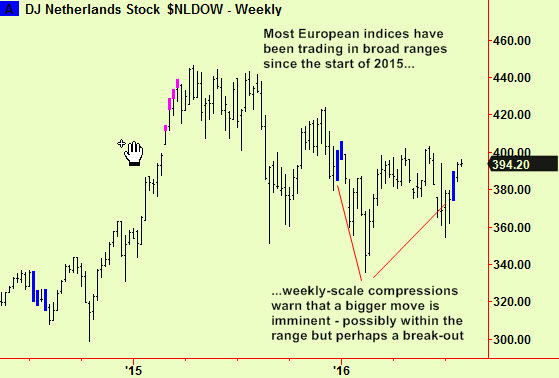
The European situation has been slightly different. There, big drops within existing broad trading ranges after the ‘Brexit’ vote were followed by big rallies so that the range continues and may only now be breaking. Holland provides a typical example, despite not being a ‘major’ market. Most recently, weekly-scale compressions have formed here and in many other European indices, which indicates that the range will probably break soon. Present indications are that the next move will be upwards as that is the direction of the apparent current break:
There have not been any top extensions in European indices as the up-move has not yet really ‘got going’. We suggested selling equity indices short when the US to extensions appeared, but mentioned that European markets probably had more downside potential. In the event, nether European nor US indices have dropped much and have traded sideways instead. This adds weight to the argument that this past ten days has merely marked a pause in an unfolding bull move and that the pause will soon end – top extensions have a median shelf life of 17 days but that median figure conceals a lot of variation so the up-move can recommence at any time. Be ready to dive out of any shorts you may have if there is no weakness in the next day or so and resume trading from the long side.
Elsewhere, there is a compression to report in sugar. This market has risen strongly in the last few months, as is its habit every few years. These ‘mini-spikes’ are typical of commodity markets where there is a lot of vertical integration in the supply chain so that any (real or prospective) minor shortage leads to a scramble for the remaining inventory. The result is a temporary run-up in price that lasts a few months followed by a drop that takes prices back to where they started. We have already tried to sell this market short once and quickly stopped out and this new compression looks as though it may offer another chance to try again. If it breaks downward, sell short. If it breaks upward, we wait.
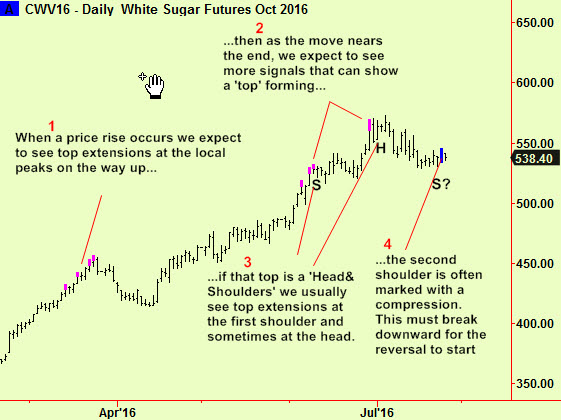
I have annotated this sugar chart to show how our methods can sometimes be reconciled with those of technical analysis. There, analysts spend a lot of time looking for tell-tale shapes traced out by the price, hoping to find some predictive power. A popular shape is the ‘head and shoulders’ which is typically found at tops, although can sometimes occur part-way up a move. We notice these shapes and although we do not try to make use of them we see that some of our signals occur as the shape develops. This may be a ‘head and shoulders’ and I have annotated the chart as if it is.
More soon.
RE
*Bubbles rarely inflate in a broad range of assets but rather in some smaller sub-group. Some tech stocks bubbled in the 1999 Nasdaq ‘Dot.com’ bubble while the broader range of stocks did not. In real-estate bubbles there are always some favoured locations that double in price then double again, while others merely rise a little, if at all. We can only guess which assets are the most bubble-prone right now and the best candidates we can see are the Nasdaq indices (again), perhaps the health care sector, particularly pharmaceuticals and care homes and maybe REITs, which are a surprisingly small sub-set of the real-estate market as a whole. Mostly bubbles form where they have formed before, so please look back in history to find other possible candidates. It doesn’t seem probable that the bubble that we think may now be forming will comprise the whole stock market.
Don’t forget – if you buy an asset because you think it will be carried up in such a bubble, don’t overstay your welcome. The last ‘bubble’ phase of a bull market typically lasts only a few months and the end is often sudden. By the same token, please don’t try to sell short until it is fully inflated and ready to burst. If we are correct in our approach and such a bubble does form, we will do our best to pick the top of it.


