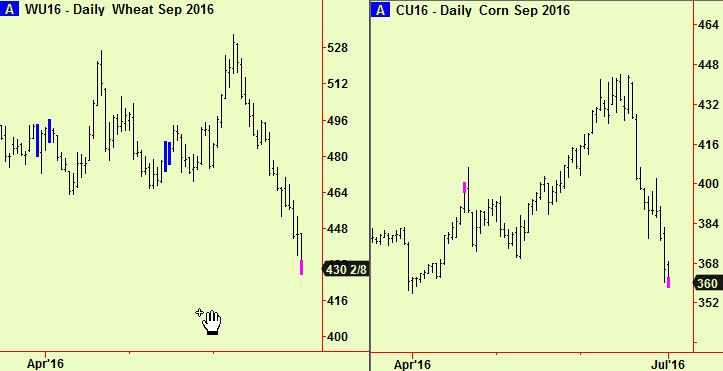
Wheat futures made a bottom extension on Friday, at a daily scale. Corn futures made the same signal on Thursday as reported in the last edition, which we now see was repeated the next day.
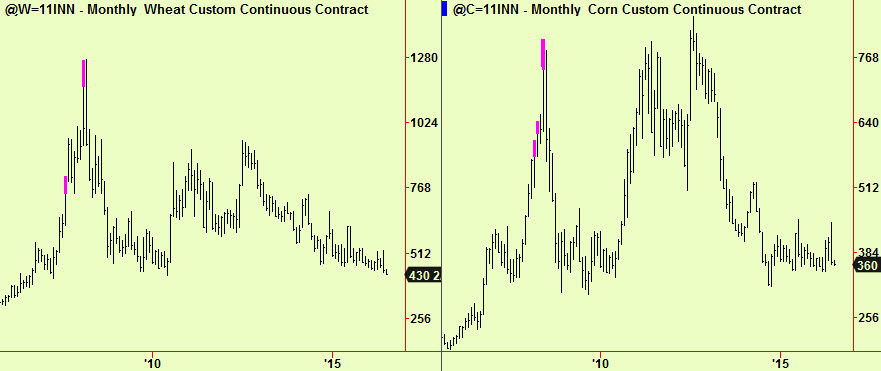
The weakness that has led to this new signal reflects the abundance of wheat in the world as measured by both yields and harvest, which has been much discussed. Less discussed is the problem of storing all this grain, some of which is simply tipped into car parks and left exposed to the weather, rodents, insects and fungus. Prices have fallen to the lowest levels since the slump of 2010, so can be considered ‘cheap’ by the standards of recent years as these monthly charts show. The world gets (an astonishing) 75m more people every year, meaning another 450m since then so these ‘surpluses’ are not going to seem so plentiful soon. Or maybe not even now.
It seems reasonable to use this new signal to add a long position in wheat to the existing long in corn. There is always some risk of cross-contamination in the grain markets when there is a sell-off in price, so you may wish to wait for some evidence that these two markets have finished dropping before adding this second long. This is a clear buy signal however, so we will not wait long before buying. We are also covering our short soya oil position at the moment, so we will be ‘net long’ of grains with a few days.
Meanwhile, there have been a couple of sector top signals in US equities:
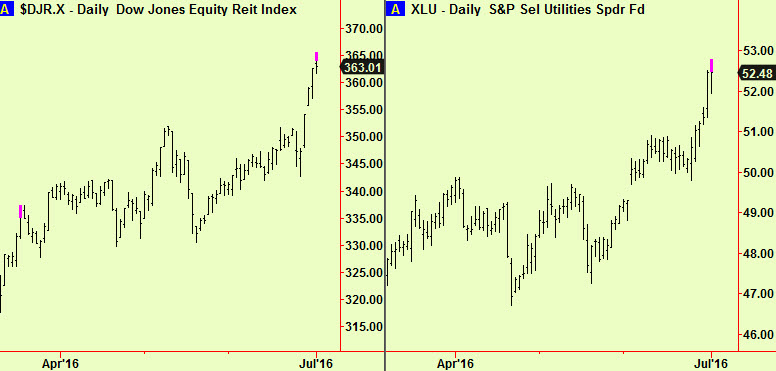
The first of these is a popular real-estate vehicle which sometimes provides early warning of impending trouble in equity markets generally – it did in 2007. It is rarely a coincident indicator, so we do not think it shows that an equity market sell-off is imminent. It does remind us however that things are not all moving in unison and that both the real estate sector and the utilities in the next chart have behaved more like fixed-income instruments in recent months. This is presumably because they both offer relatively predictable revenues at a time when bond yields have vanished. This price run-up into top extensions reflects the same kind of rush that we have seen in US T bonds, T notes and various Euro-denominated Government bonds in the last few weeks – these are all over stretched and we have recommended selling many of them in recent editions.
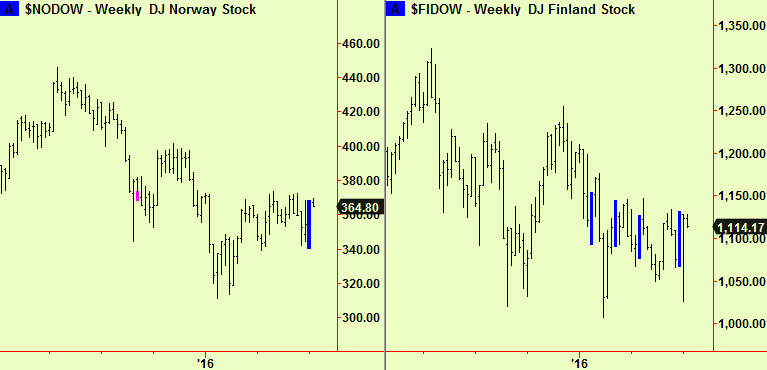
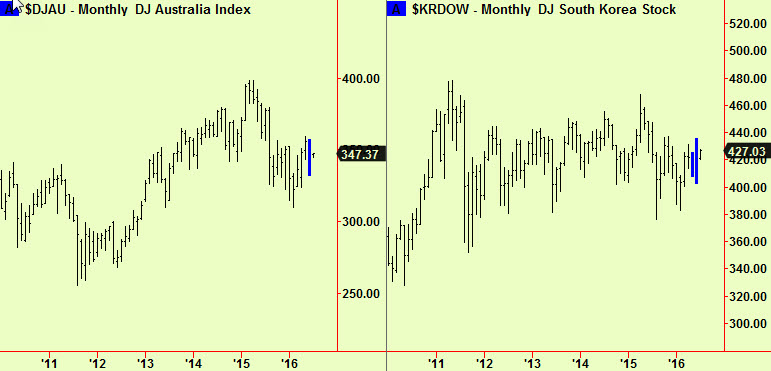
There have been fresh weekly-scale compressions in two Scandinavian stock markets and monthly-scale compressions in Australia and Korea. This comes as no surprise, after the trendless ‘churning’ that we have seen but it is a reminder that many (if not all) markets around the world can still adopt a new trend in either direction with little or no warning from here. We favour an eventual upwards move in many of them (especially the US) for reasons often given here but the signal must be paramount in our analysis and we don’t like anticipating a break. A little patience here will be rewarded in due course. Charts:
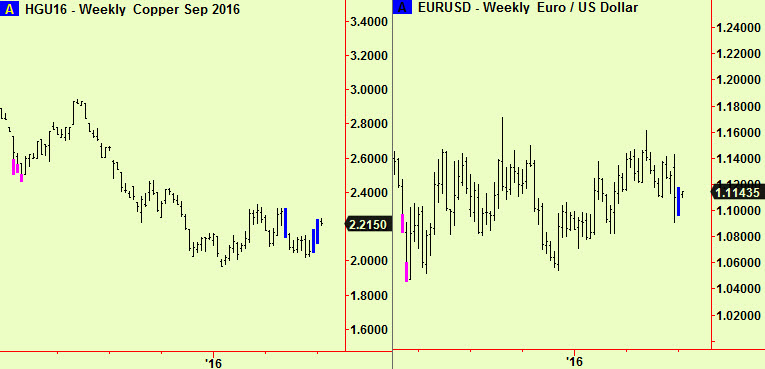
Lastly, there have been new weekly compressions in copper futures and (perhaps surprisingly) in the $/€ exchange rate. This is another good reminder that markets are rarely moved much by news, despite what you may read in market commentary and these two important measures of the state of the world are both still stuck, awaiting a move: