
Equity markets mainly fell last week. US indices stayed within the tight range that we have warned would continue for a while, but Europe was weaker and several important compressions broke to the downside – see later in the report. This is a particularly important time in world equity markets because several defining long-term signals are expiring while others have yet to produce results. We start with the long term.
We often see important signals in the ‘secondary’ indices – those which are less watched than the S&P, Nasdaq or Dow. There were monthly-scale top extensions in the NYSE composite and the Russell 2000 18 months-2 years ago, which warned that an end to the uptrend was coming but the shelf-life of these signals is now over.
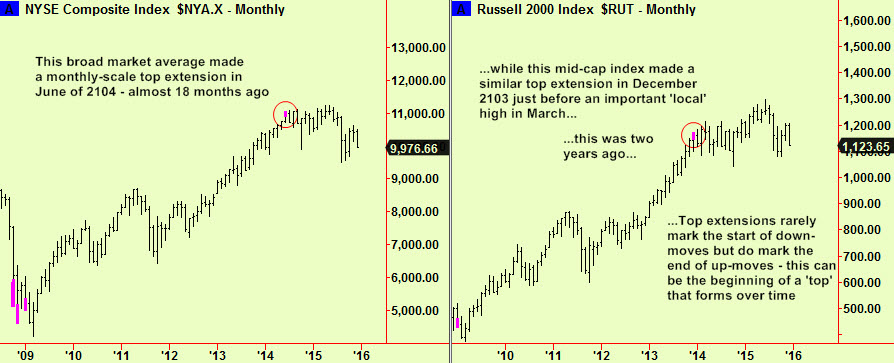
We don’t usually report new monthly signals because their timing is too vague and it is very easy to lose money by adopting a contrary view too early. We do use them to compile our own views and reports however and to illustrate historic points of analysis, like now.
These monthly tops provide excellent ‘early warning’ of an end to an uptrend but don’t signal that we should exit all stock market investments immediately – there is usually plenty of time and they may only indicate that a pause is due, not a reversal. There were more rallies to come after these first signals and eventually more monthly-scale top extensions emerged in the more usual indices, such as this Dow futures contract – one year ago:
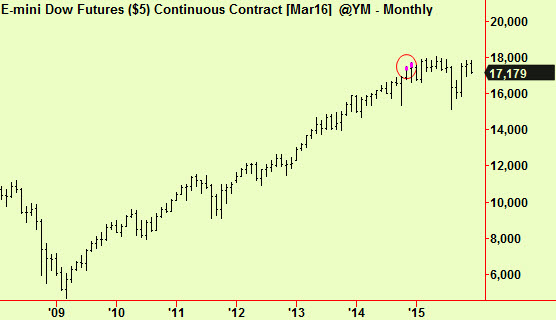
…with similar extensions in Europe shortly afterward:
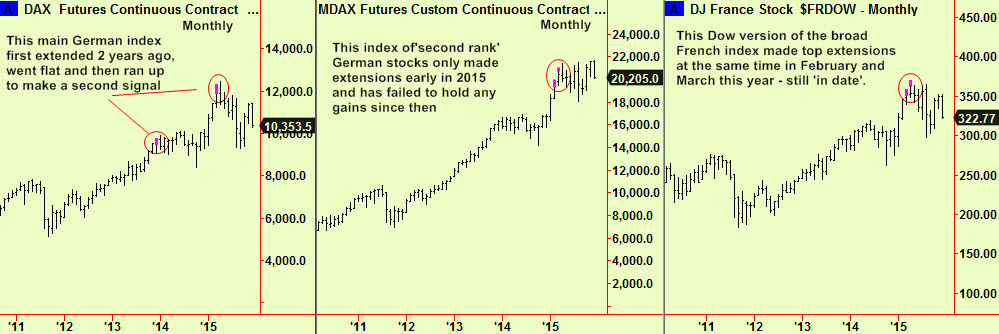
This set the scene for a ‘top’ to form in the usual manner after a long bull market, or perhaps just a ‘flat’ period which could lead to another leg up into a ‘bubble’ stage or final ‘exhaustion’ move. We have written about this several times in the past year and now the edge of the cliff is approaching – do stocks fall or do they fly?
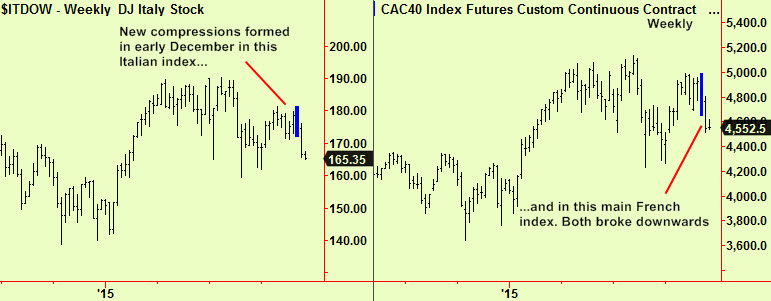
The medium-term situation is the key to this. We have reported weekly-scale compressions in European and US equity indices over the past few months and here is the current picture, starting with Europe. Weekly-scale compressions formed and broke downward in several European indices in late summer. Here are British and French examples –

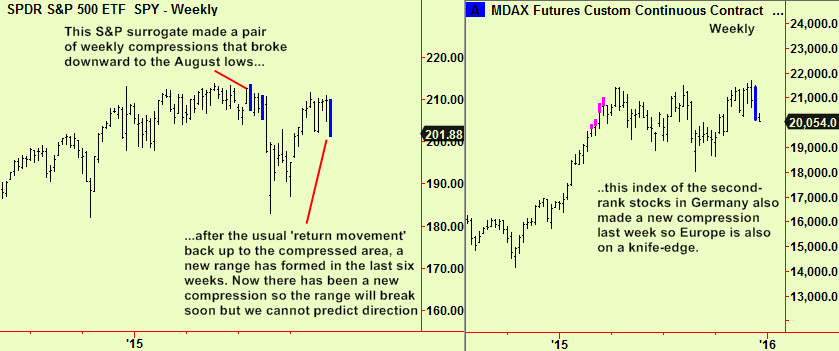
The drop was followed by a rally back up to the compressed area (we say a ‘return movement’) and then new compressions formed and apparently broke downward at the end of last week –
We say ‘apparently’ because this would seem bearish if it were not for the behaviour of some US indices and one German index last week. The US has continued to ‘churn’ sideways and so have some Europeans. In consequence, we have new weekly-scale compressions that mean these markets on both sides of the Atlantic are not in down-trends but instead poised on the edge of that cliff. We will soon see whether they will fall or fly from here…
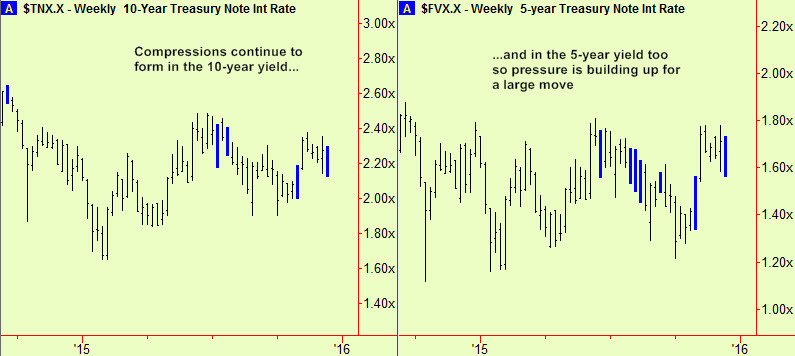
There are similar new weekly-scale compressions in US bond market yields (see below) so we expect a new break there too soon – again we cannot tell yet which way. It remains possible to trade from both sides of the market in stocks and bonds while these ranges last but please be aware that we are dancing very near the edge.
More later on other markets – there are new weekly-scale bottom extensions in WTI and Brent crude oil, in heating oil, natural gas and soya meal too which seem to show that the current weakness in commodities will soon end, or pause. Mexican stocks also have made a new weekly-scale bottom extension and there have been some other daily-scale bottom extensions in quite small equity markets such as South Africa and Greece. This not enough evidence to say ‘buy stocks’ but we watch closely. There is also a good tendency for US stocks to rise during December – the mythical ‘year-end rally’ – which has happened in 9 out of the last 12 years so while the evidence is mixed, we wait.


