
The rally in US and European equity markets continued throughout last week, taking the three main indices that we follow (S&P500, Dow industrials, Nasdaq) back up near to the highs made earlier in the month. There is overhead resistance from some older weekly-scale compressions that are just above, or at these levels and the rally has seemingly stalled at this point for that reason. Now what?
We have seen fresh weekly-scale compressions in some US indices in the last two weeks. This means a new trend is coming but probably not just yet.
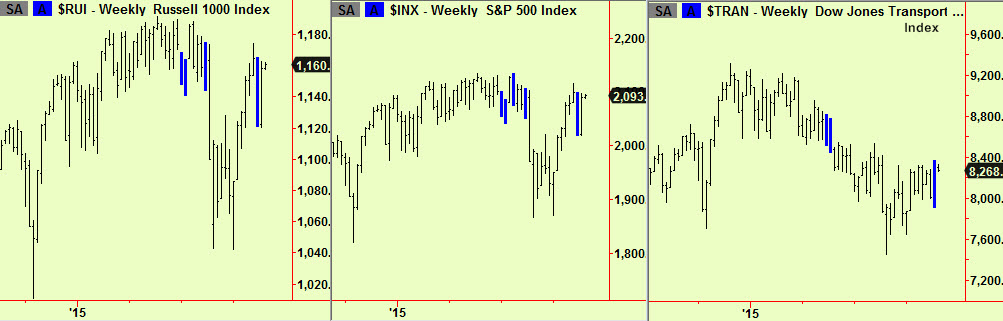
Experience shows us that weekly-scale compressions that form in a price area where others have previously formed (like this) will probably not break into a new trend immediately. Accordingly, prices are likely to stay in the range bounded by the recent highs and recent lows, meaning 2000-2100 in the S&P, with occasional moves a bit beyond these limits. This is going to be tradeable but with some danger as the break out of the range is coming, even if it may be a few weeks away – we can’t tell when for sure. The way to trade a range is to buy when prices are near the bottom end and reverse into shorts when prices are near the top but this carries the risk that the eventual break will come quickly, finding the trader positioned the wrong way before there has been any chance to gather a cushion of trading profits. A large loss can result so we will look for helpful clues from any daily-scale or intra-day signals to indicate that it is time for prices to reverse within the range, as time goes by.
On a longer-term note: There is a point that we have not made before concerning the price drop and recovery in equities during late August. This was sharp in both directions, especially in US instruments but looking only at the broad indices obscures the amount of panic that was involved. Our stock-in-trade is to gauge market mood, using Hurst measures and other tools (see the video section for more) which makes us sensitive to all shifts in sentiment, whether we can measure them or not. This helps us throw some light on older but still valid market observations, using modern illumination.
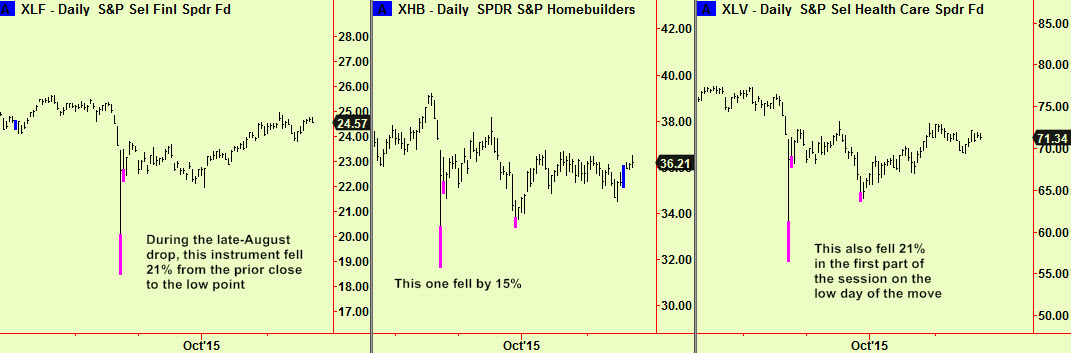
A sure sign of a long-lasting market ‘bottom’ is when panicky sellers throw in the towel or ‘capitulate’ as is the usual expression. There were bottom extensions at a weekly and even a monthly scale in some of the US sector instruments at the end of the late-August sell-off but this is not the only point – these are traded instruments, not mere calculated indices. Accordingly, when the XLF Financial sector ETF fell 21% from 23.64 at the close on Friday August 21st to a low of 18.52 the next trading day, someone sold that low point – see first chart below. This is a pretty good example of panic selling and it wasn’t unique. Some other examples:
In practical terms, this means that those weaker folk who could be easily ‘shaken loose’ by the drop probably were – this selling without regard to price was a fairly convincing ‘selling climax’. This places the US market (and maybe therefore others too) in a technically stronger position than it might appear. Although some months have passed since this event, it seems probable that weaker-financed (or weaker-willed) longs have not yet returned in sufficient numbers to make another sharp drop likely soon. Down-side risk will remain reduced for some while to come.
The situation is different in the far East and we will write on this in the next few days – the risk of weakness there is greater and we may focus our equity short-selling on China and its satellites for the next few weeks.
On Oil:
We wrote a piece in the October 23rd edition on the difficulties the Saudis have in increasing production at a time when this would provide comfort to their enemies in the Syrian (and Yemeni) conflicts. Since then the planets have moved around and re-aligned. Saudi Arabia, Iran and Russia are now all allied against the Islamofascists at Isil/Daesh and this changes things in the oil market.
Saudi Arabia has profoundly mis-played its hand twice in recent years – once by allowing crude prices to climb so high that alternatives were encouraged and next by trying to crush those alternatives by frantic pumping to cause low prices. These departures from apparently settled long-term policy aims have been disastrous for the kingdom and the damage to their ability to stay in control will be profound. By now, the existence of two wars on their borders – in both of which they are active participants – have revealed the Saudi’s pressing need for money. Their financial reserves seem big but would only be adequate in peacetime – wars are always expensive and modern wars astonishingly so. Fighting two at once is unwise even for the most experienced combatants and the Saudis are not experienced. They would like to reverse their stupid policy of flooding the market with crude but have been inhibited from doing so because these low prices hurt their opponents in Syria (Iran and Russia) even more. Iran is their enemy in the Yemen war too and so allowing prices to rise would have been doubly difficult without losing face..
Now, a new alignment has begun in which everyone agrees that the awful Isil/Daesh must be eliminated in Iraq and Syria so Saudi Arabia, Iran and Russia are united in this one aim even if they are separated by others. This means that the oil price may soon be under much less pressure as the Saudis can reduce output without the embarrassment of seeming to backtrack. These enemies are now allies, at least for now and the fight against Daesh will probably be long. We will watch for signals that tell us we can buy energy contracts and will advise. The brave could try buying natural gas again now (we ‘timed-out’ of the last attempt recently, or even crude oil. Our model portfolio cannot (yet) take either trade as it is up to the 3-position limit for commodities.


