
We issued ‘cover all shorts’ advice in equity markets late on Friday, as prices rallied. This recommendation came because of some signal combinations, not merely because prices moved up – we often ‘lean against’ the current price trend, but this looks like the start of something bigger.
The immediate cause of our re-think was a 240-minute compression in Dow futures that was breaking up, as described in Friday’s edition. We don’t often refer to intra-day signals like this and mostly do so only when a current daily-scale signal is nearing (or at) the end of its shelf life. The last daily-scale signal was a large number of bottom extensions on August 24th/25th in various equity markets, which lapsed about three weeks ago, which is why we started paying attention to the smaller-scale signals like this one.
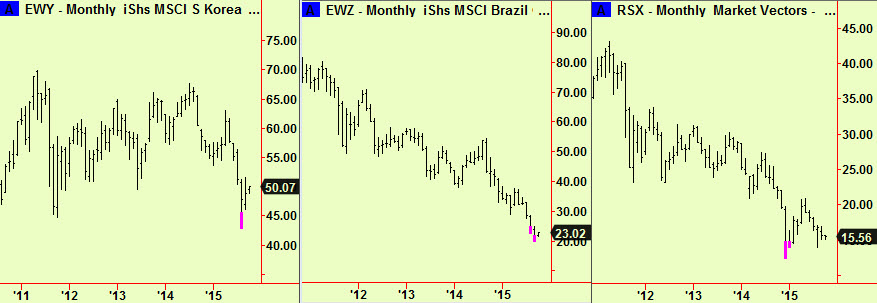
There is a longer-term reason to be bullish too – there were some scattered bottom extensions at weekly and even monthly-scales in recent weeks. These have not been uniformly spread as the markets concerned have not all moved the same way. Some national indices have been weak enough to generate monthly bottom extensions – only Korea and Brazil very recently but Russia has also been re-testing lows made at extensions at the turn of last year:
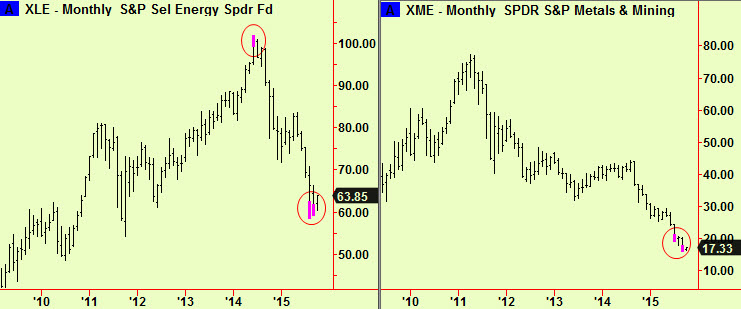
Other monthly-scale signals have only occurred in Oil & Gas production or Oil & Gas exploration or the mining or materials sectors, where great weakness in the prices of the underlying assets has resulted in a sell-off in the shares of companies involved in their production. Glencore is only the most public example of this – it has been widespread throughout the sector. Two examples:
There have been many more weekly-scale extensions, including one in a Dow tracker, shown first (top left) in this next group of charts:
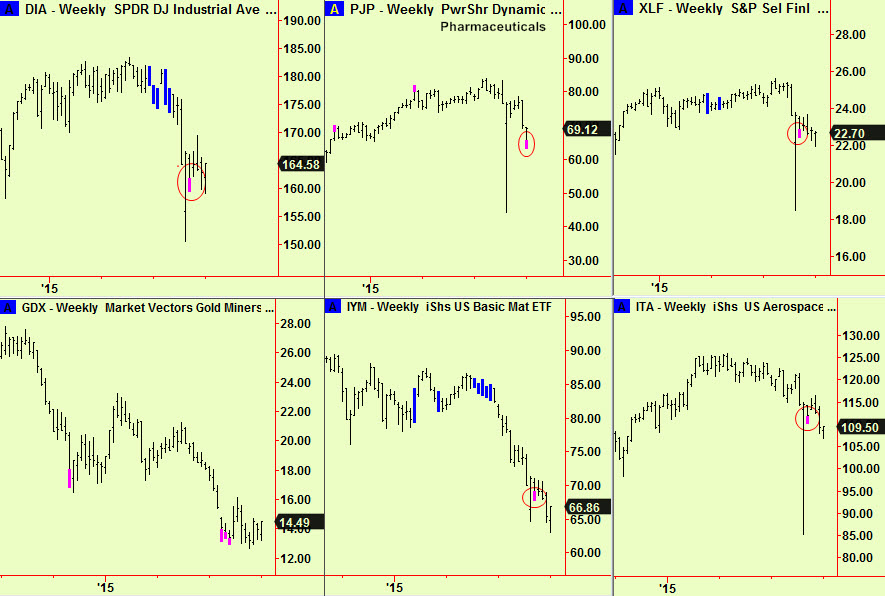
Each of these separate signals contributes to this review but none is individually conclusive – when all are put together with the signal reported on Friday it looks as though conditions have just shifted sharply from a bit bearish to quite bullish. It seems likely that equity markets will not fall further from here. Some will rally and others will probably form new ranges in which the highs will be marked by the compression bars seen in the DIA chart, top left above. We would expect resistance at those old compressions for reasons often given here but the level is quite far above the market at the Dow equivalent of around 17,100 or so, which is 4% above current levels. Other markets have more potential.
We will be trying to identify which instruments to buy to take advantage of this new viewpoint but in the meantime any decent dip (1-2%) in the major generic index instruments in the markets that have decent potential (S&P, Dax, FTSE, Eurostoxx, Nikkei, Korean Kospi, Brazilian Bovespa) may be bought – perhaps Russia should also be on this list. We will advise further as the next few days go by.


