
Grain prices fell throughout last year as part of the continued fall-out from the great rise that pushed prices very high again in 2012. It is unusual for grain prices to be quite as well-correlated as they have been in the last decade which makes it likely that there is a common cause. That would seem to be the rise of consumer numbers in Asia and (more recently) Africa and their increasing taste for meat, which requires a lot more acreage to produce the end product – cows must eat too and their food has to be grown. This has made agricultural booms bigger lately and the accompanying over-enthusiasm of speculators has led to busts that take prices right down to levels where they must be considered cheap. The world population is around 7bn now and heading for 9bn or even 10bn by 2050. Expect more of these big rises until we discover another unfarmed continent.
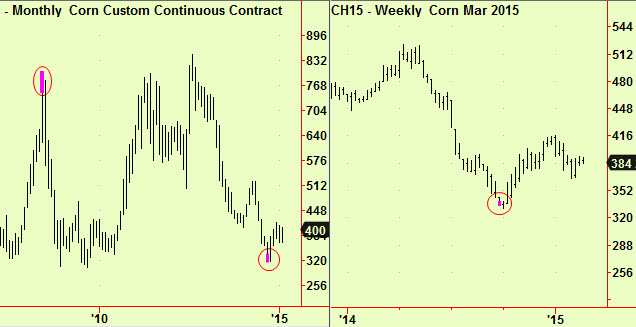
The clearest picture is in corn (maize to non-Americans) which dropped into a monthly-scale bottom extension in September last year, arguing that the main drop is over and that dips should be bought. Monthly signals are useful long-term clues but are too imprecise for trading, so it was useful that we had a weekly-scale bottom extension at the same moment. This signal has now about elapsed after 20+ weeks, so we wait for another:
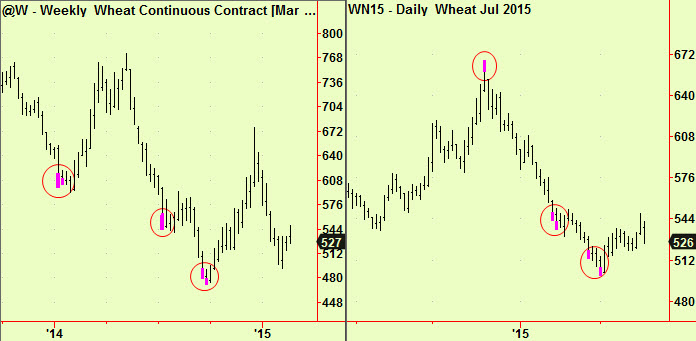
The situation in wheat is similar although we have been less successful in identifying the twists and turns. There has been no monthly-scale signal and three distinct weekly-scale bottom extensions since the beginning of last year. The first and third led to good rallies but the middle one led only to a flattening of the drop for 2 months. These are normal outcomes from extensions – prices may reverse or flatten – but the reversals are of course much more satisfying. The daily-scale analysis has been two-sided. Wheat made a top extension at the highs of December, after which prices dropped through all of January, There was a pair of bottom extensions half-way through the month that persuaded us to recommend a long position but there was no rally. The trade almost ‘timed-out’ when we got another extension near the end of the month that led us to give the long position extra time and that elapsed earlier today. Now we are flat but waiting for another chance to enter – probably on the long side again.
Soya has also been declining but has not yet become ‘cheap’. That may be because the single biggest beneficiary of the recent demand for meat has been the main cattle feed, which is soya meal. This is made by crushing soya beans into meal and oil and has relegated the oil to being something of a by-product. This keeps soya meal prices buoyant while oil prices stay weaker. This corrects sharply from time-to time as lazy speculators who have long meal/short oil positions get squeezed but it is still a feature of the market. The underlying demand for meal will probably keep prices high as the ‘new normal’.
Again there have been no monthly signals but soya meal and soya beans both made weekly-scale bottom extensions in September last year. Only meal is shown here (first chart) as the two charts and their signals are very similar. After a dip that led to a daily-scale bottom extension in soya oil (ringed in the last chart) we have just seen a daily-scale compression in May delivery soya meal that looks like a buying opportunity (middle chart) as it has since broken upward. Buy some here.

The analysis of grains requires us to look across different markets and contracts to make inferences about the general picture, as shown here. We are sometimes asked why we don’t automate the trading from our signals – this crossover analysis process requires the involvement of a human being and is the reason why (as yet) we cannot.


