
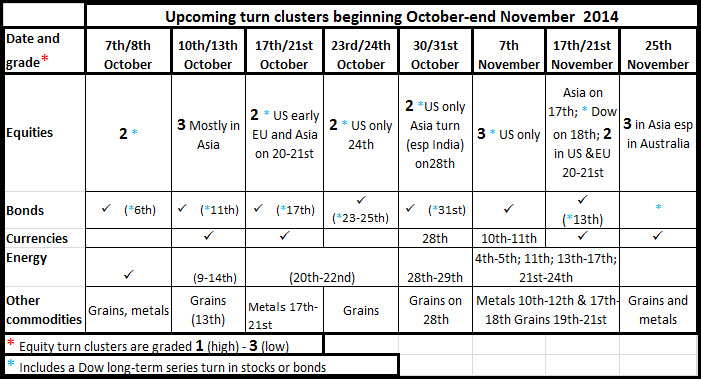
Here is the schedule of likely turn dates from now until the last week of November. It is more densely-packed than the last schedule, reflecting the greater number of turns. The main highlights are:
There are a lot of turns due from the long-term Dow series of both equity and bond prices – all marked with a blue asterisk *. These are calculated using a slightly different method from the one we use for the ‘normal’ turns and they tend to pick out the highs and lows of longer-term importance. When they come thick and fast like this it usually means greater turbulence ahead – not necessarily market drops but probably ‘churning’ up and down.
The scores for the equity turns (1-3, from high to low in size) are always no more than educated guesses and that is particularly so in this next period. Turns are plentiful but also quite diffuse so we have had to resort to date ranges when a number of turns are spread over several days. This is also why we have not graded any equity turn a full ‘1’ in this table – it’s because of the lack of a clear single date on which an otherwise strong signal might emerge.
At the moment it seems that the turns due over the next two days the 7th/8th October and the period across the weekend 17th/20th or 21st October are a little stronger than the others but much depends on what is happening as the dates approach, as usual – a sharply rising market that produces an extension into a turn day means a strong signal, for example. See the userguide for more on this. We will comment further as the weeks pass.
 f
f


